_mw67o9lf.png)
Deep Learning | Convolutional Neural Network | Ensemble Learning
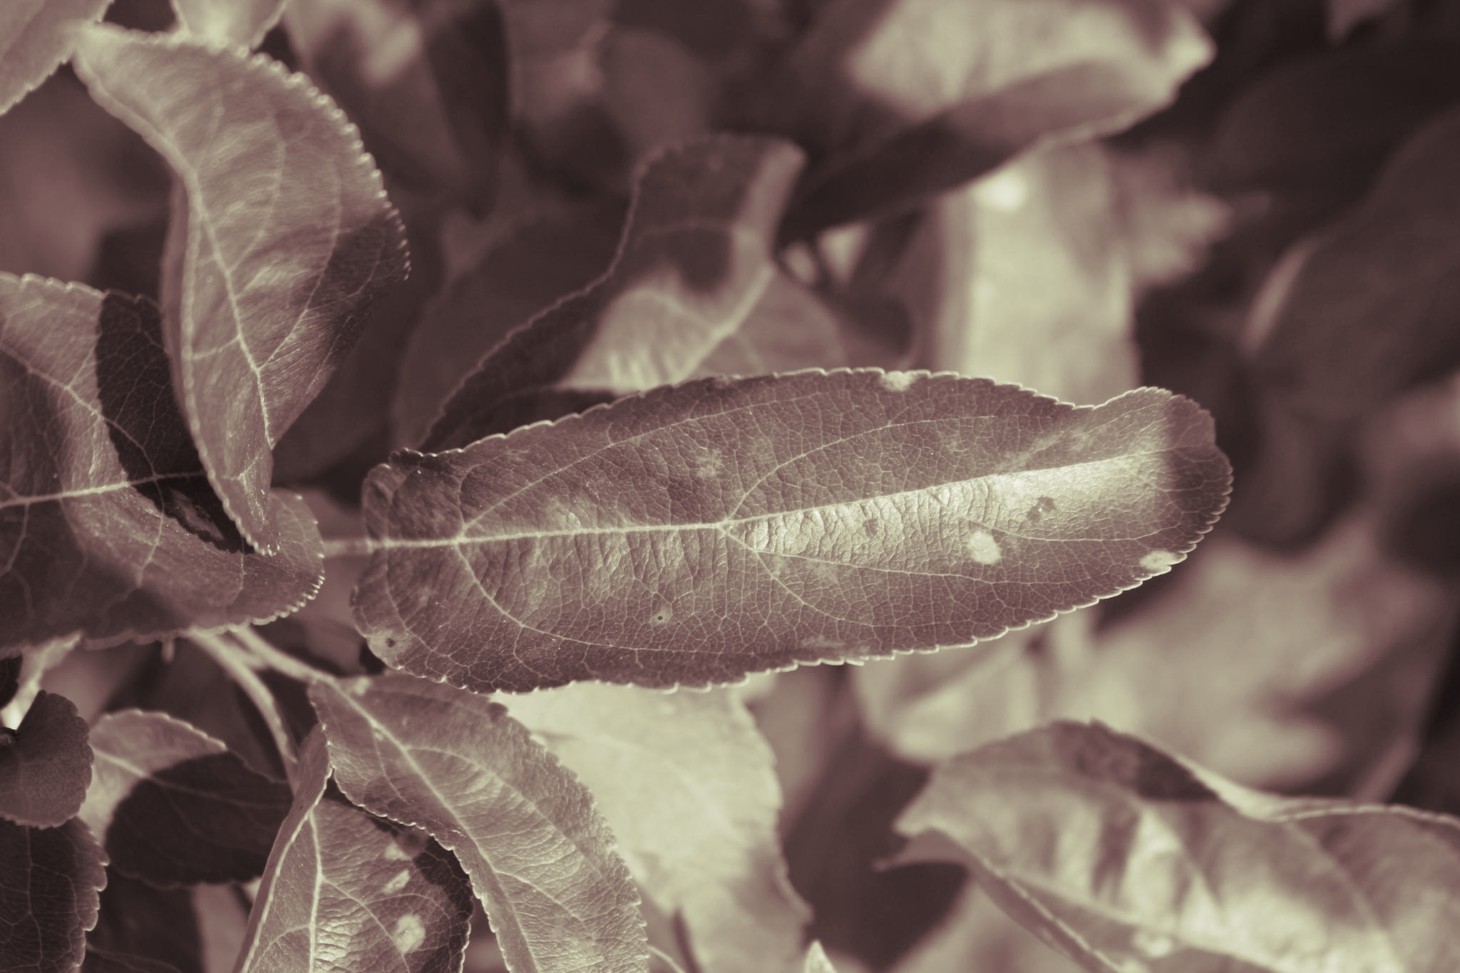
Various foliar diseases in apple leaves degrade the quality of apple fruit. Therefore, classification of the diseases in real-time is an important task to battle the growth of the disease. This project focuses on developing an ensemble deep learning model to classify the diseases in apple leaves.
Final year research project
Team-based: 4 members
Duration: 1 year from Aug 2021 - Jul 2022
Developed ensemble model using python,
Constructed front-end interfaces with streamlit
Python, Tensorflow & Keras, OpenCV, Pandas, Numpy, Streamlit, Google Colab Pro & VS Code
Plant leaf diseases are a major threat to the growth of the respective species in agricultural production. As a result, reduced yield rates can lead to indeterminable economic downfall. Therefore, the detection and classification of plant leaf diseases play a significant role in agricultural production.
We conducted a literature survey to understand the existing machine learning methodologies and approaches to addressing the problems related to plant leaf diseases. From our study, we formulated two important pieces of information:
Among the plant leaf diseases, the detection and classification of apple leaf diseases are
least examined.
Ensemble learning approaches are least explored.
With the two pieces of information in mind, we framed a problem statement:
Note: The problem statement is quite narrowed. The reason is that we wanted to address the existing gaps from our literate review.
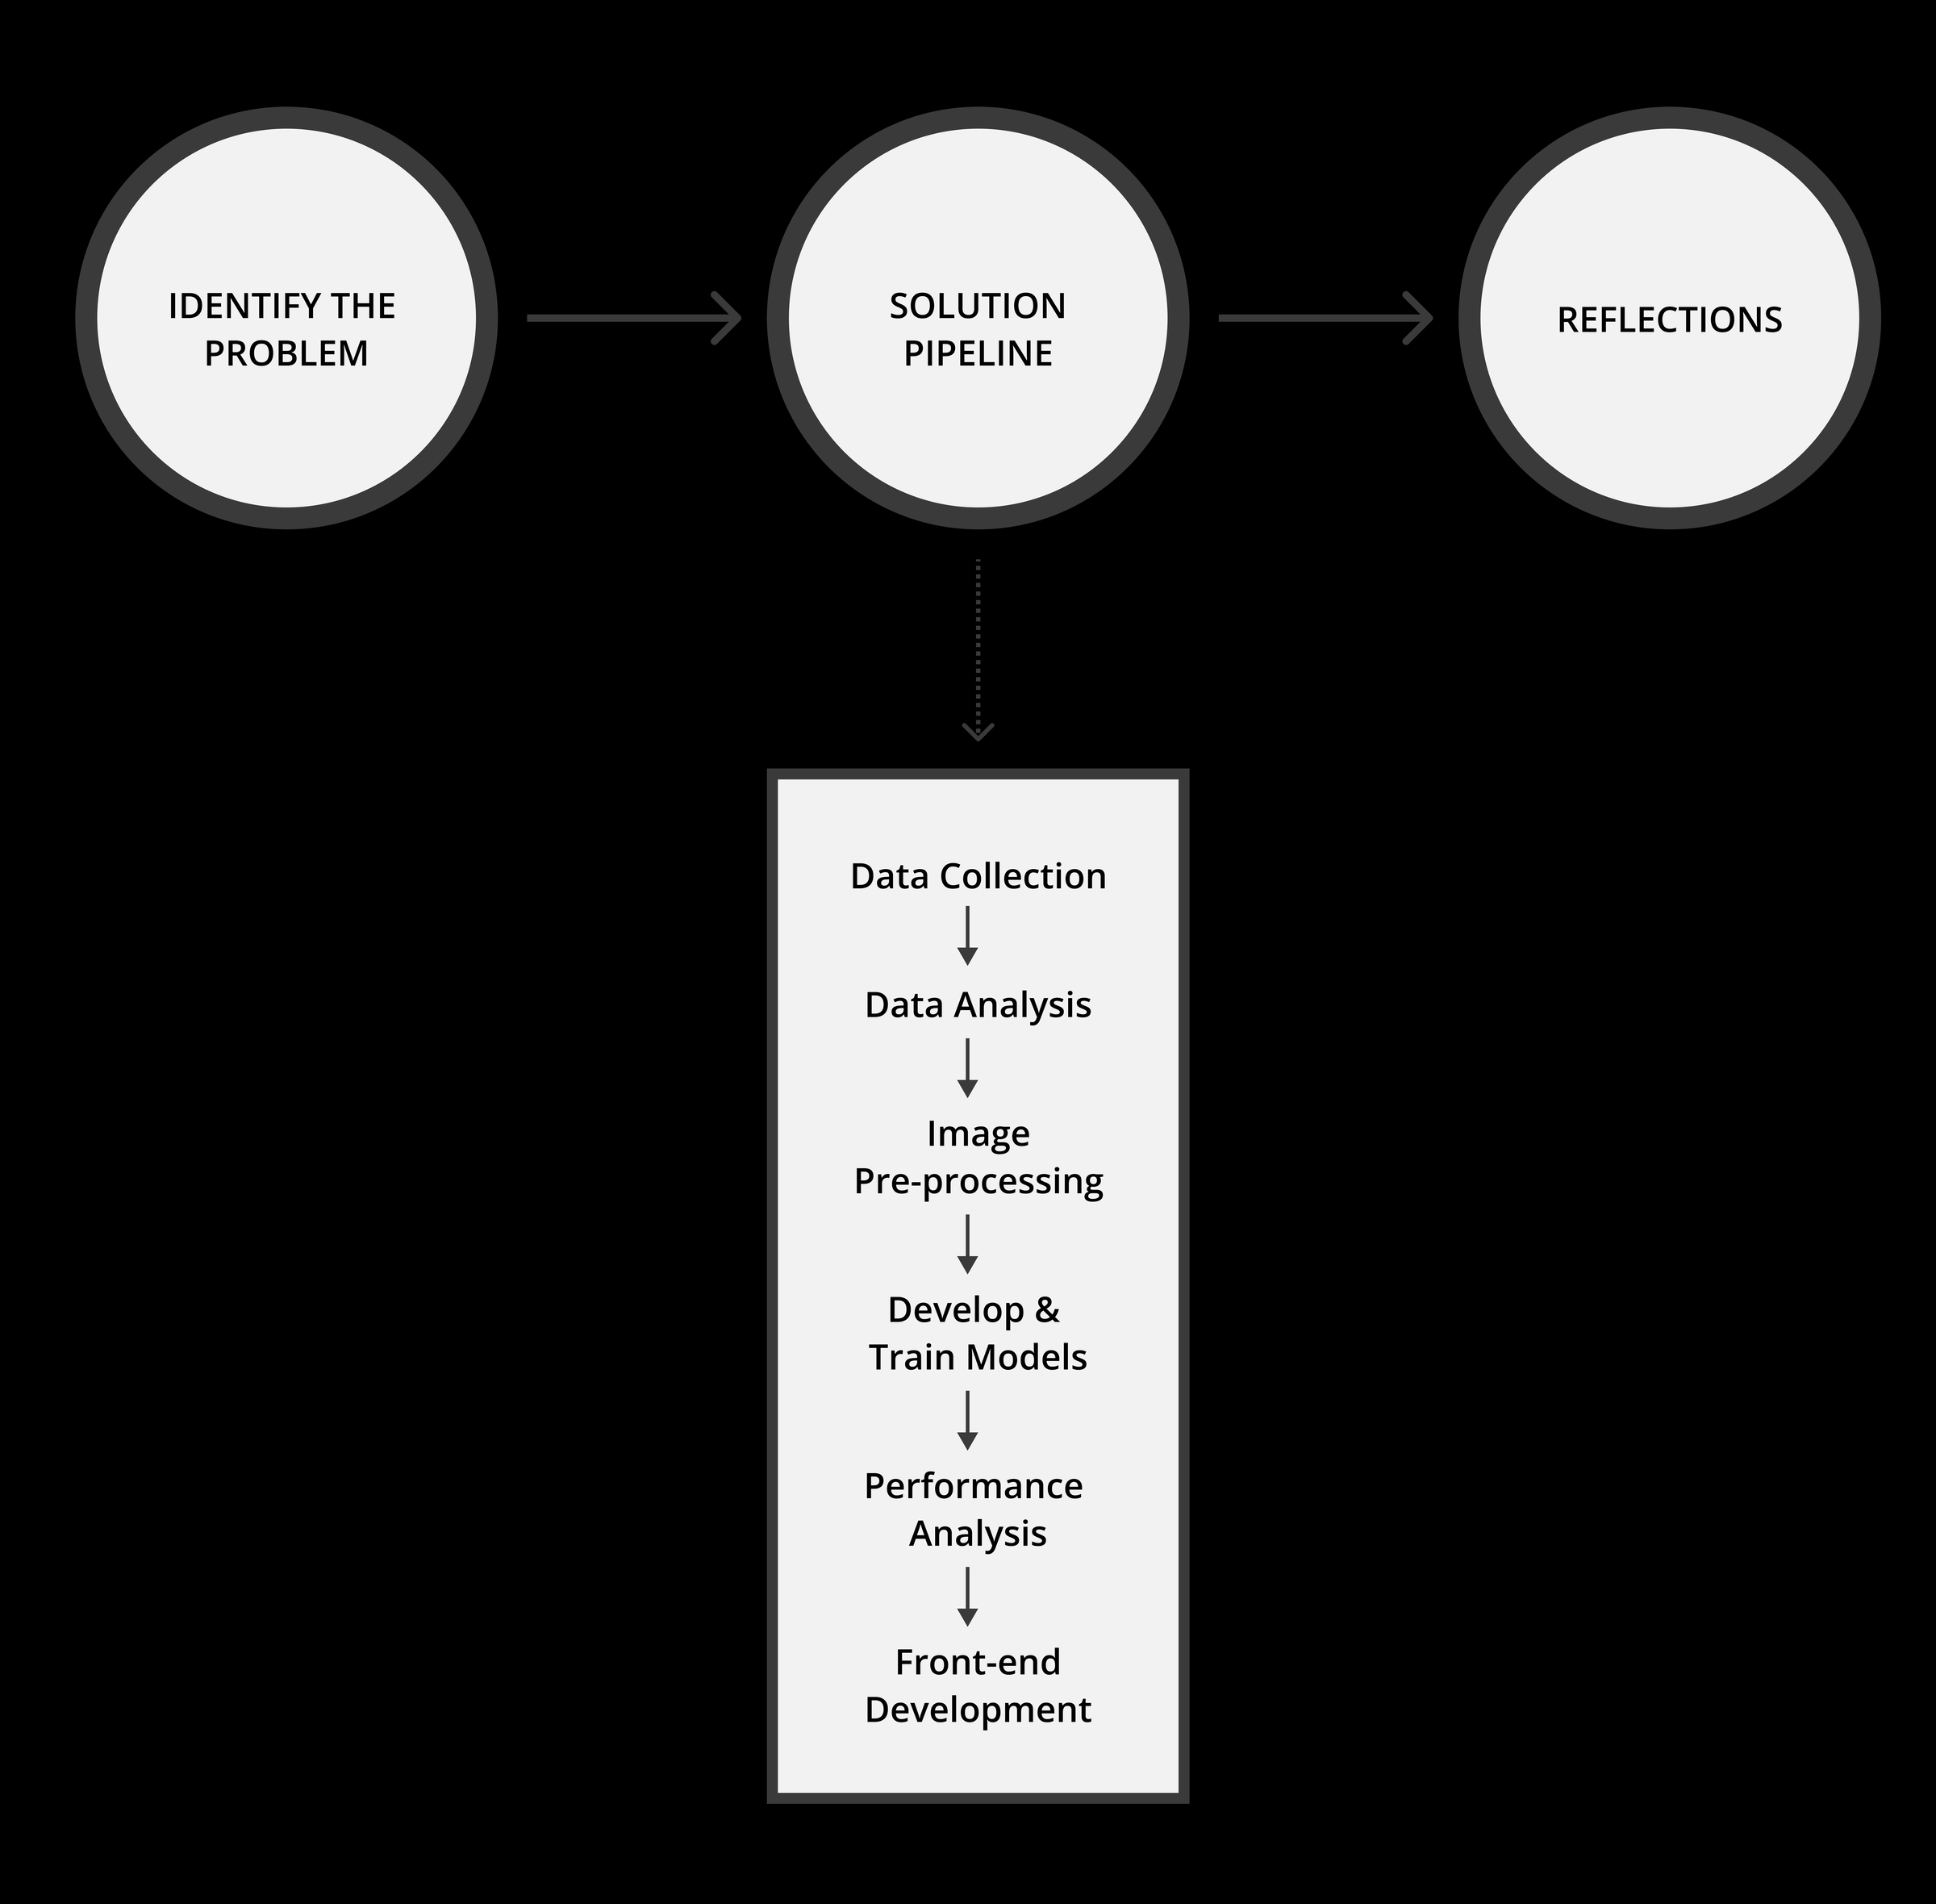
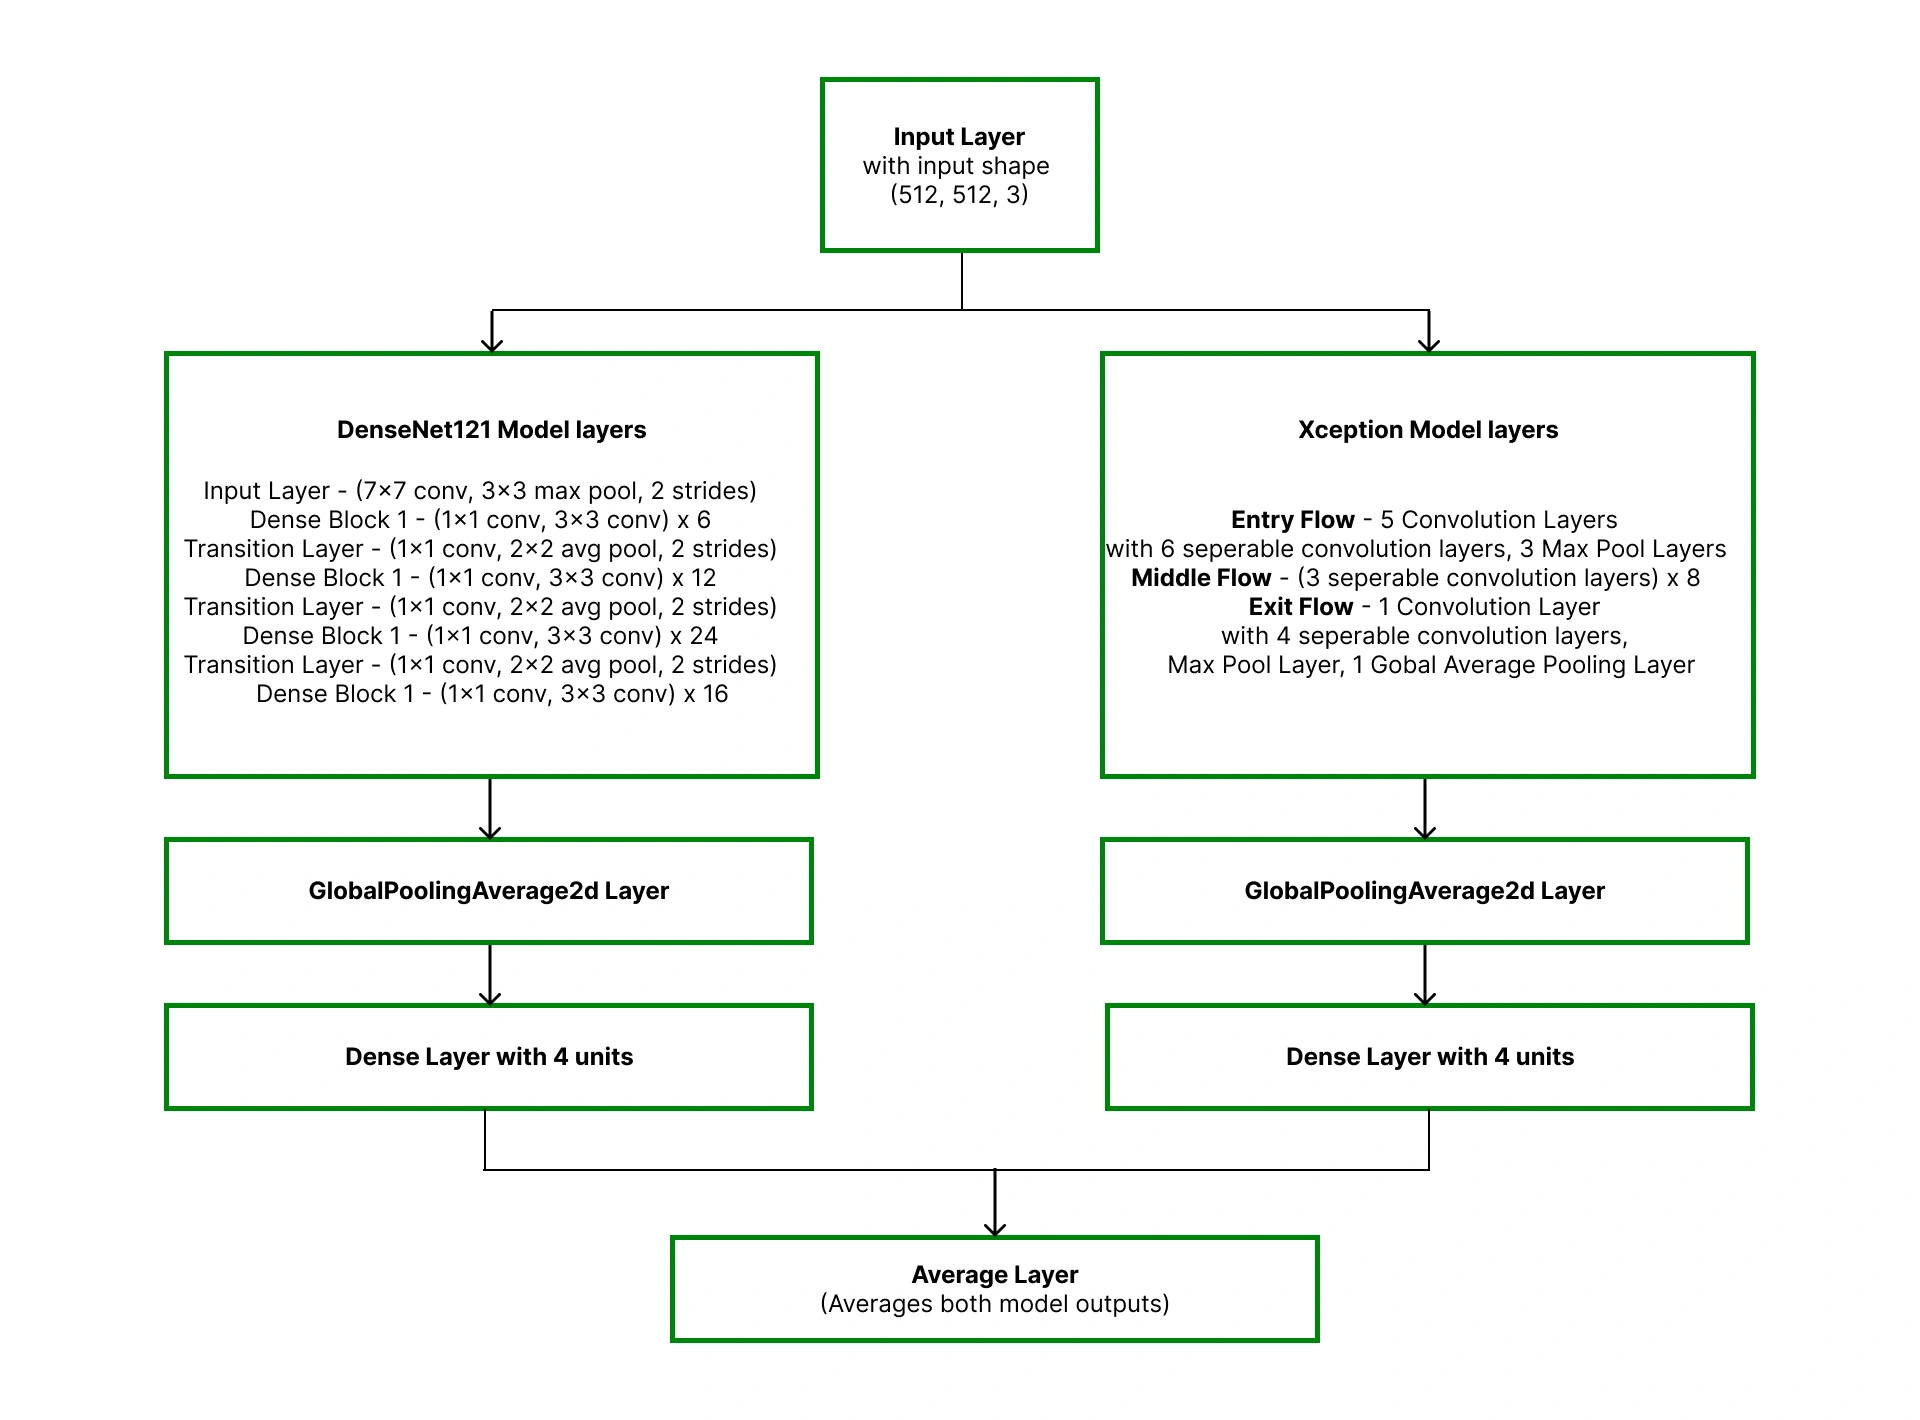
Our proposed solution is to develop an ensemble learning model with appropriate image processing techniques. We focus on ensemble modeling because it enhances model performance significantly when compared to single base models.
We conducted data analysis to study the dataset using a few visual techniques. This step in our project allowed us to understand the dataset better before we proceeded to the pre-processing phase.
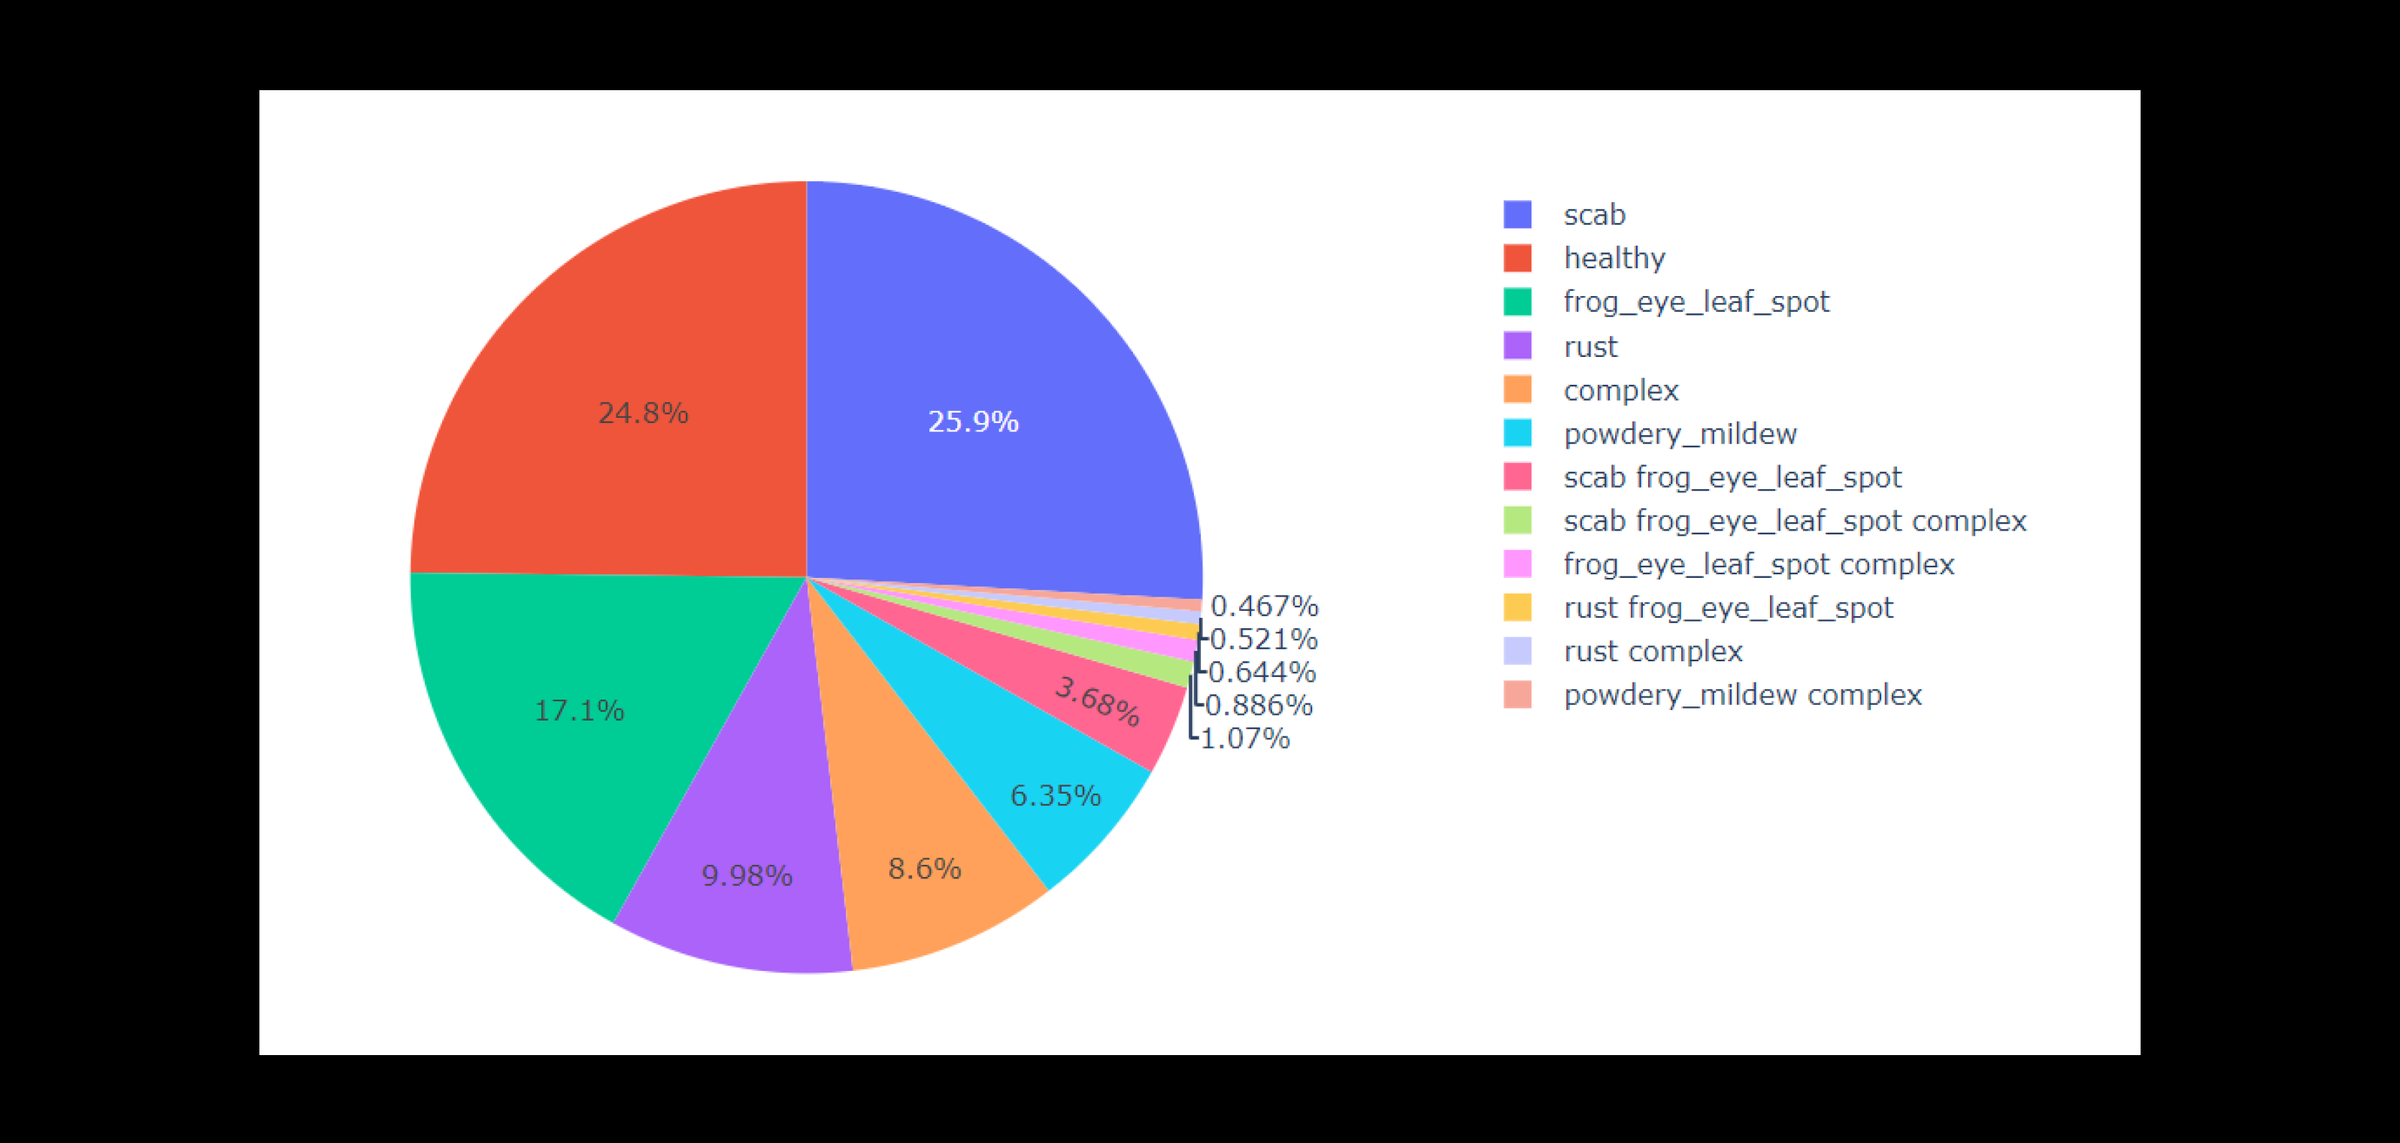
Dataset type: jpg file type with CSV file containing image annotations.
Dataset Size: 18,632
No.of Classifications: 12
Color scheme: RGB
Image Resolution: 2048 x 1035
Types of Diseases: healthy, complex, frog_eye_leaf_spot, frog_eye_leaf_spot complex, powdery_mildew, powdery_mildew complex, rust, rust complex, rust frog_eye_leaf_spot, scab, scab frog_eye_leaf_spot, scab frog_eye_leaf_spot complex
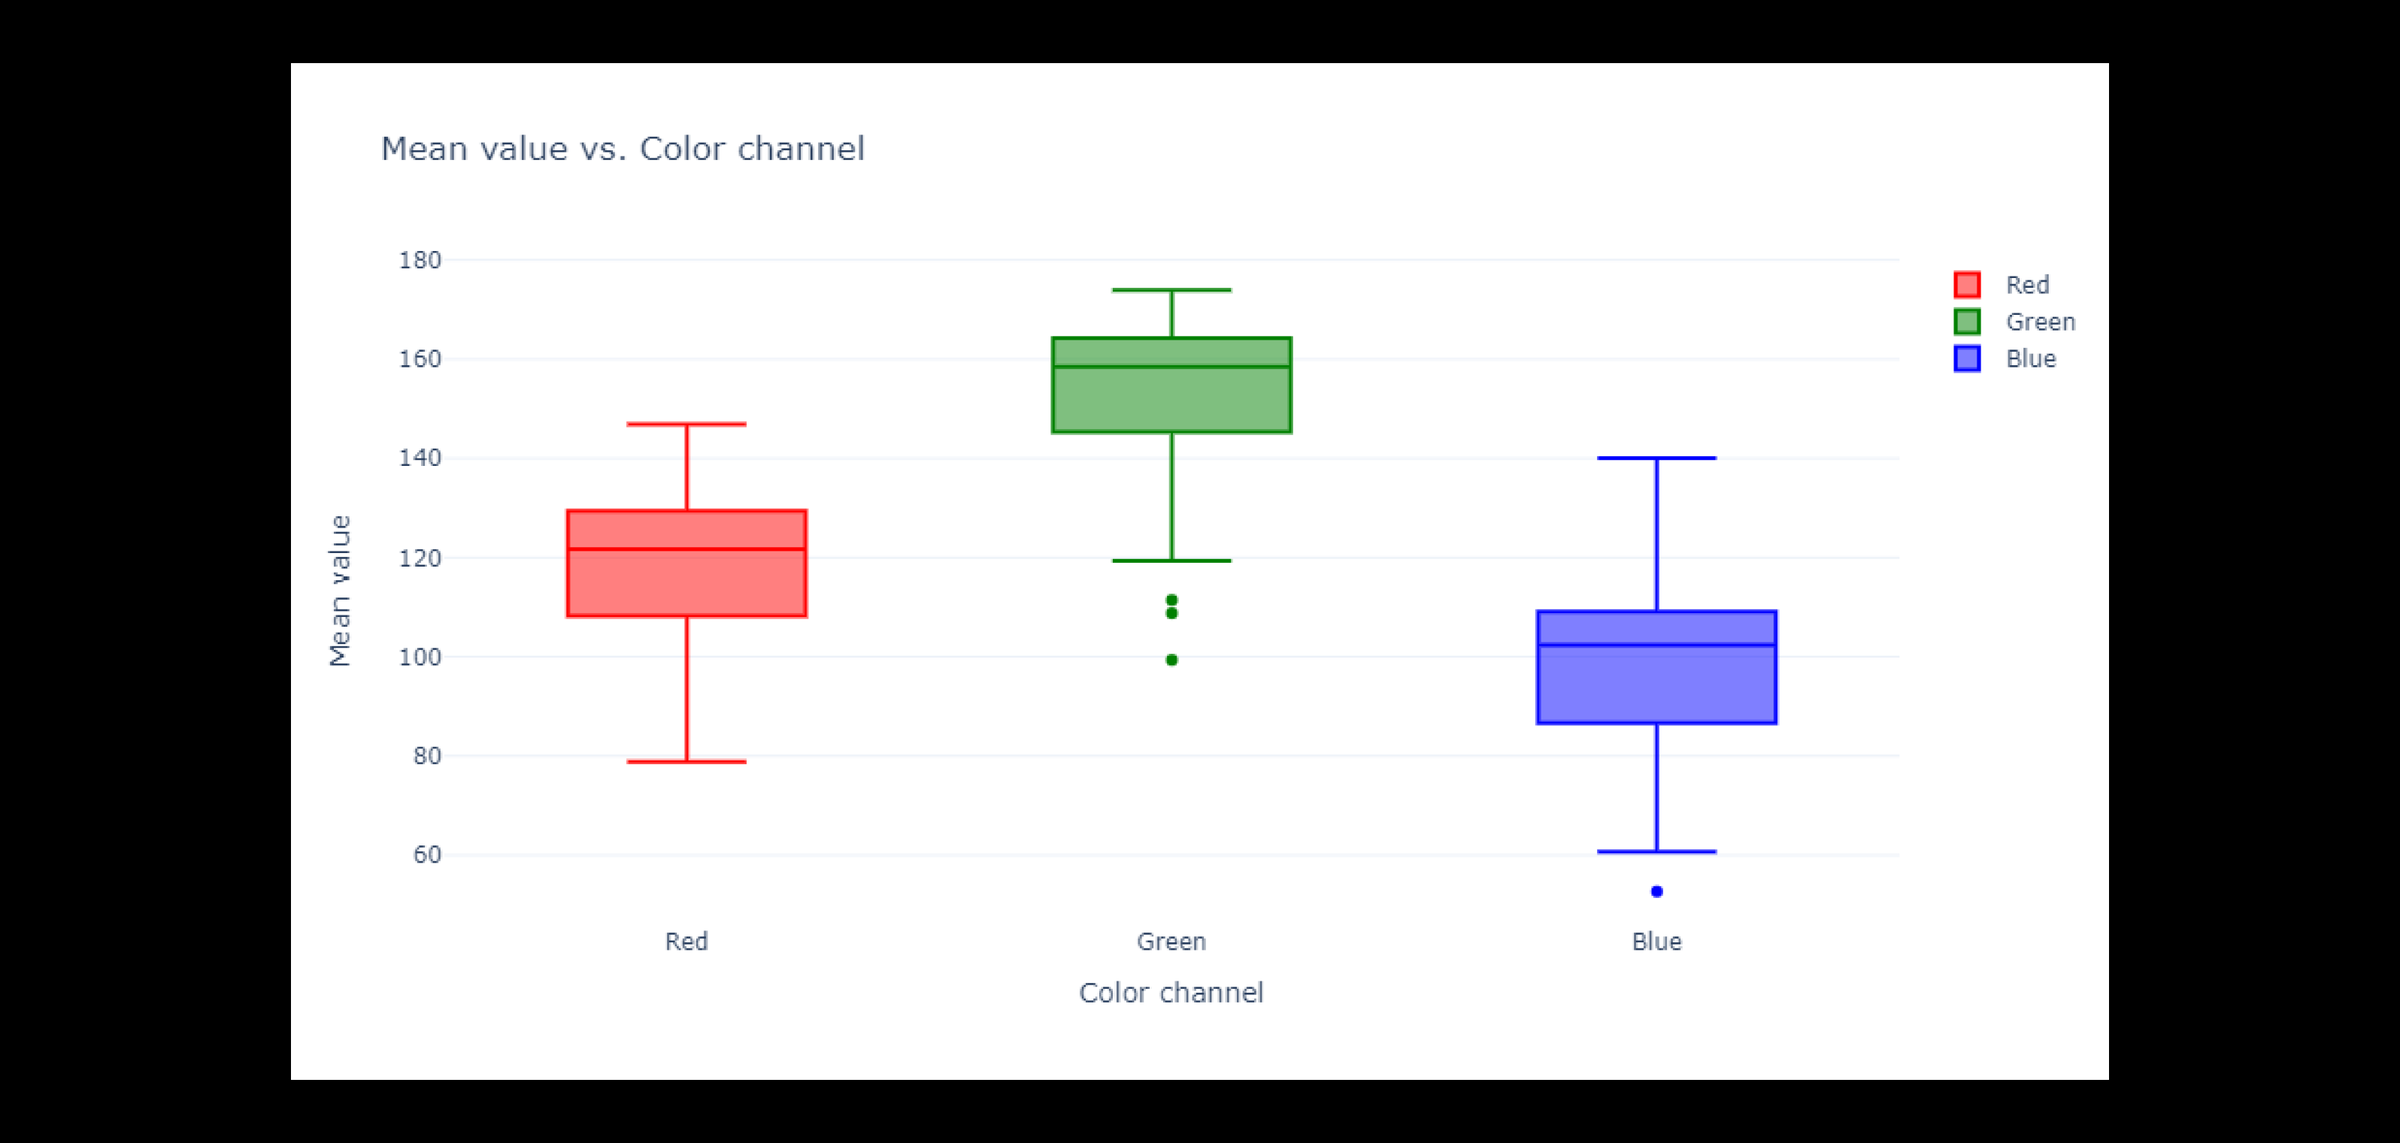
After understanding the basic components of the dataset, it was necessary to analyze the RGB channels because it is important to understand how various diseases differ from each other from the perspective of the RGB value distribution.
We used histograms to plot the frequency of pixels' intensity values. In an RGB color space, pixel values range from 0 to 255 where 0 stands for black and 255 stands for white. Analysis of a histograms helped us understand the brightness, contrast and intensity distribution of an image.
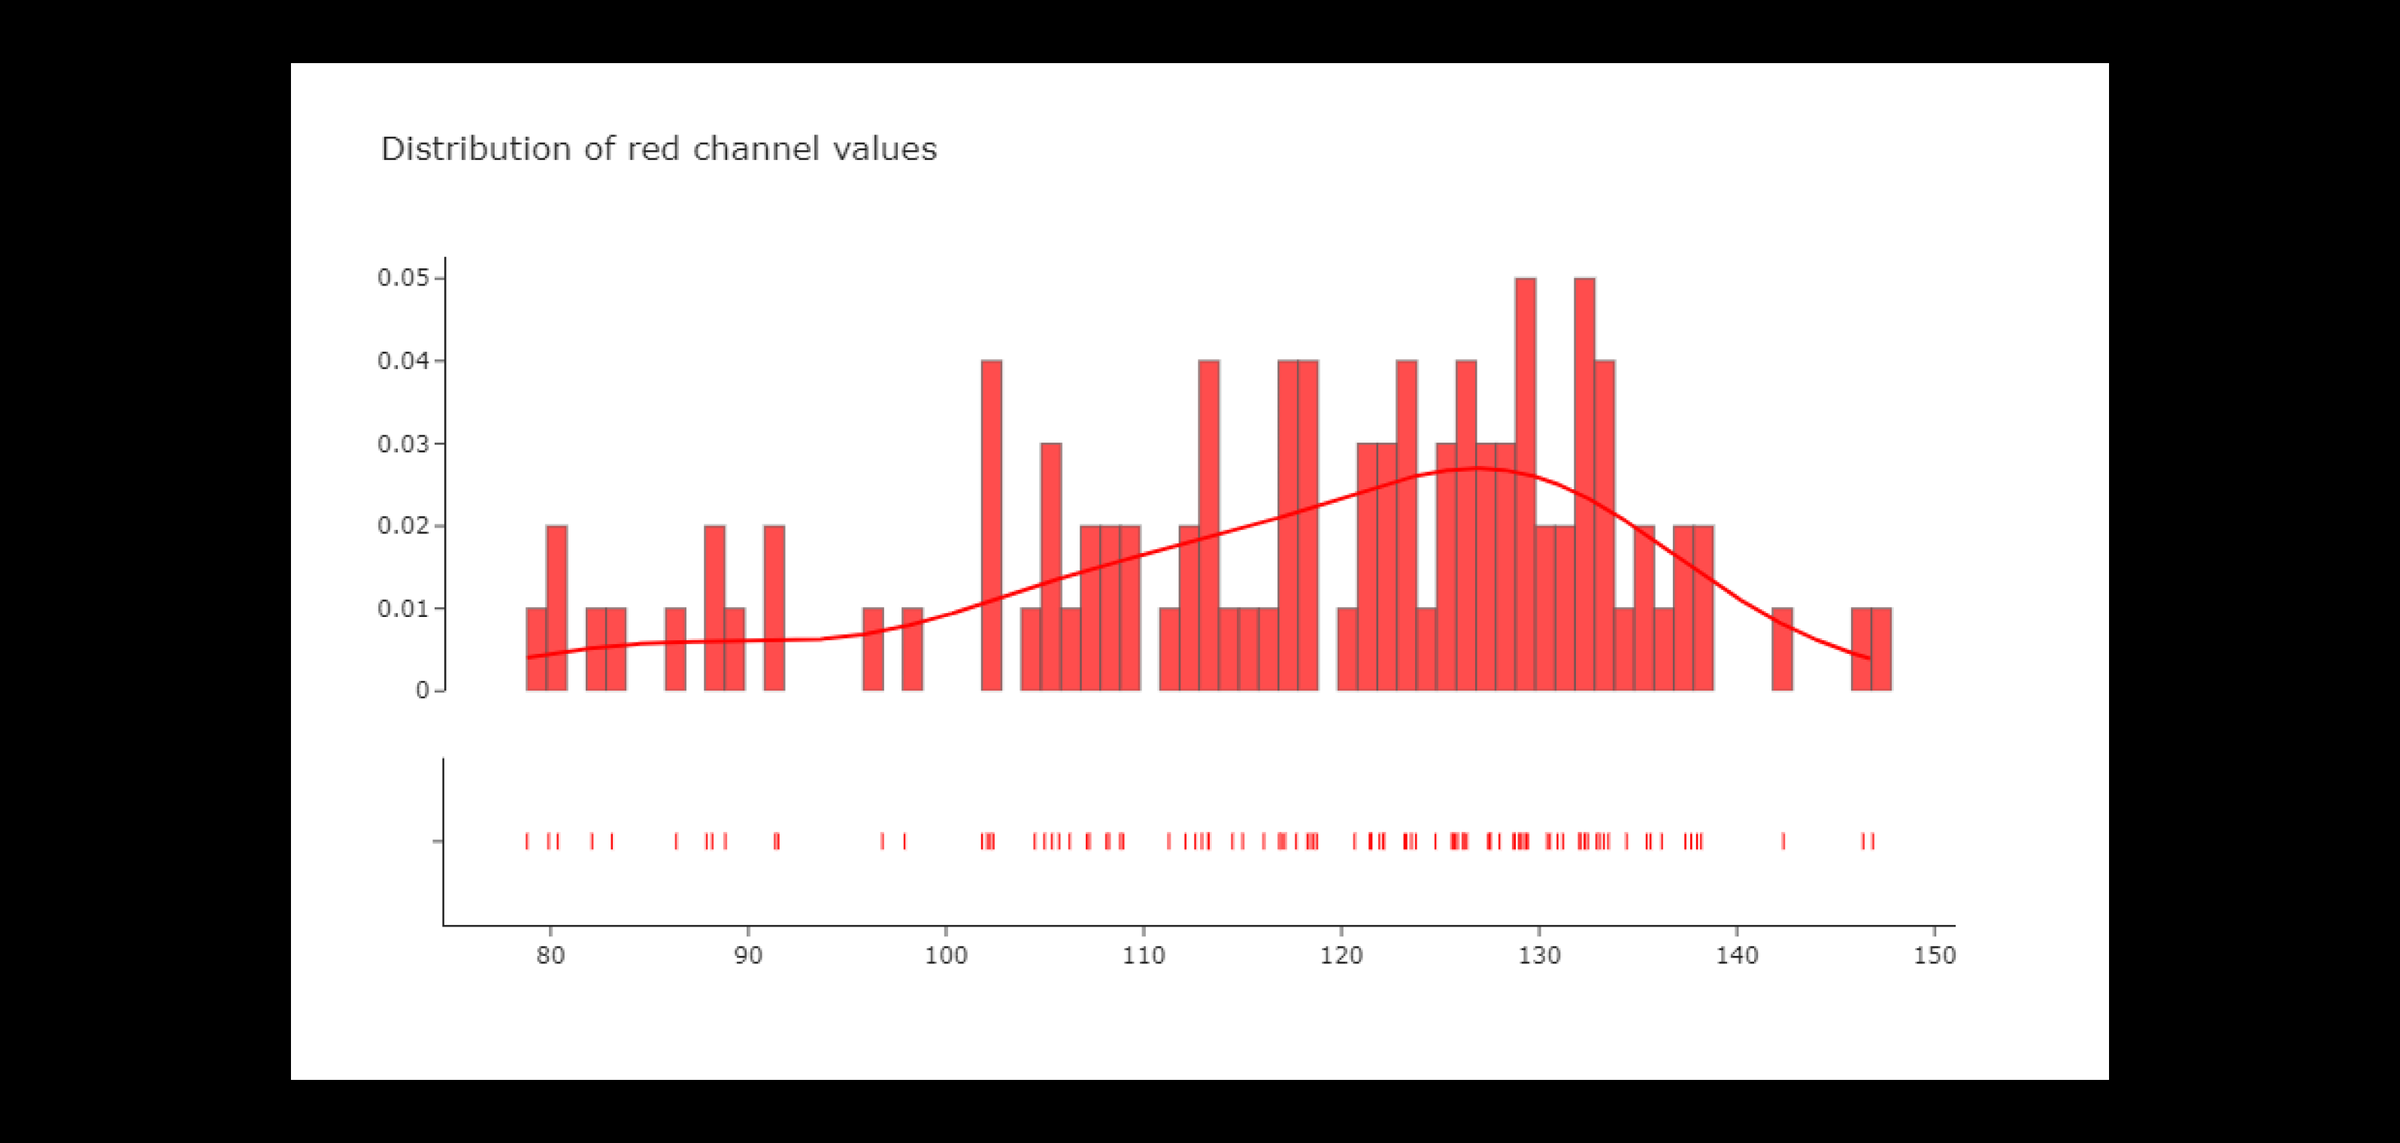
The red channel values seem to roughly normal distribution, but with a slight negative skew. This indicates that the red channel tends to be more concentrated at higher values, at around 100. There is large variation in average red values across images.
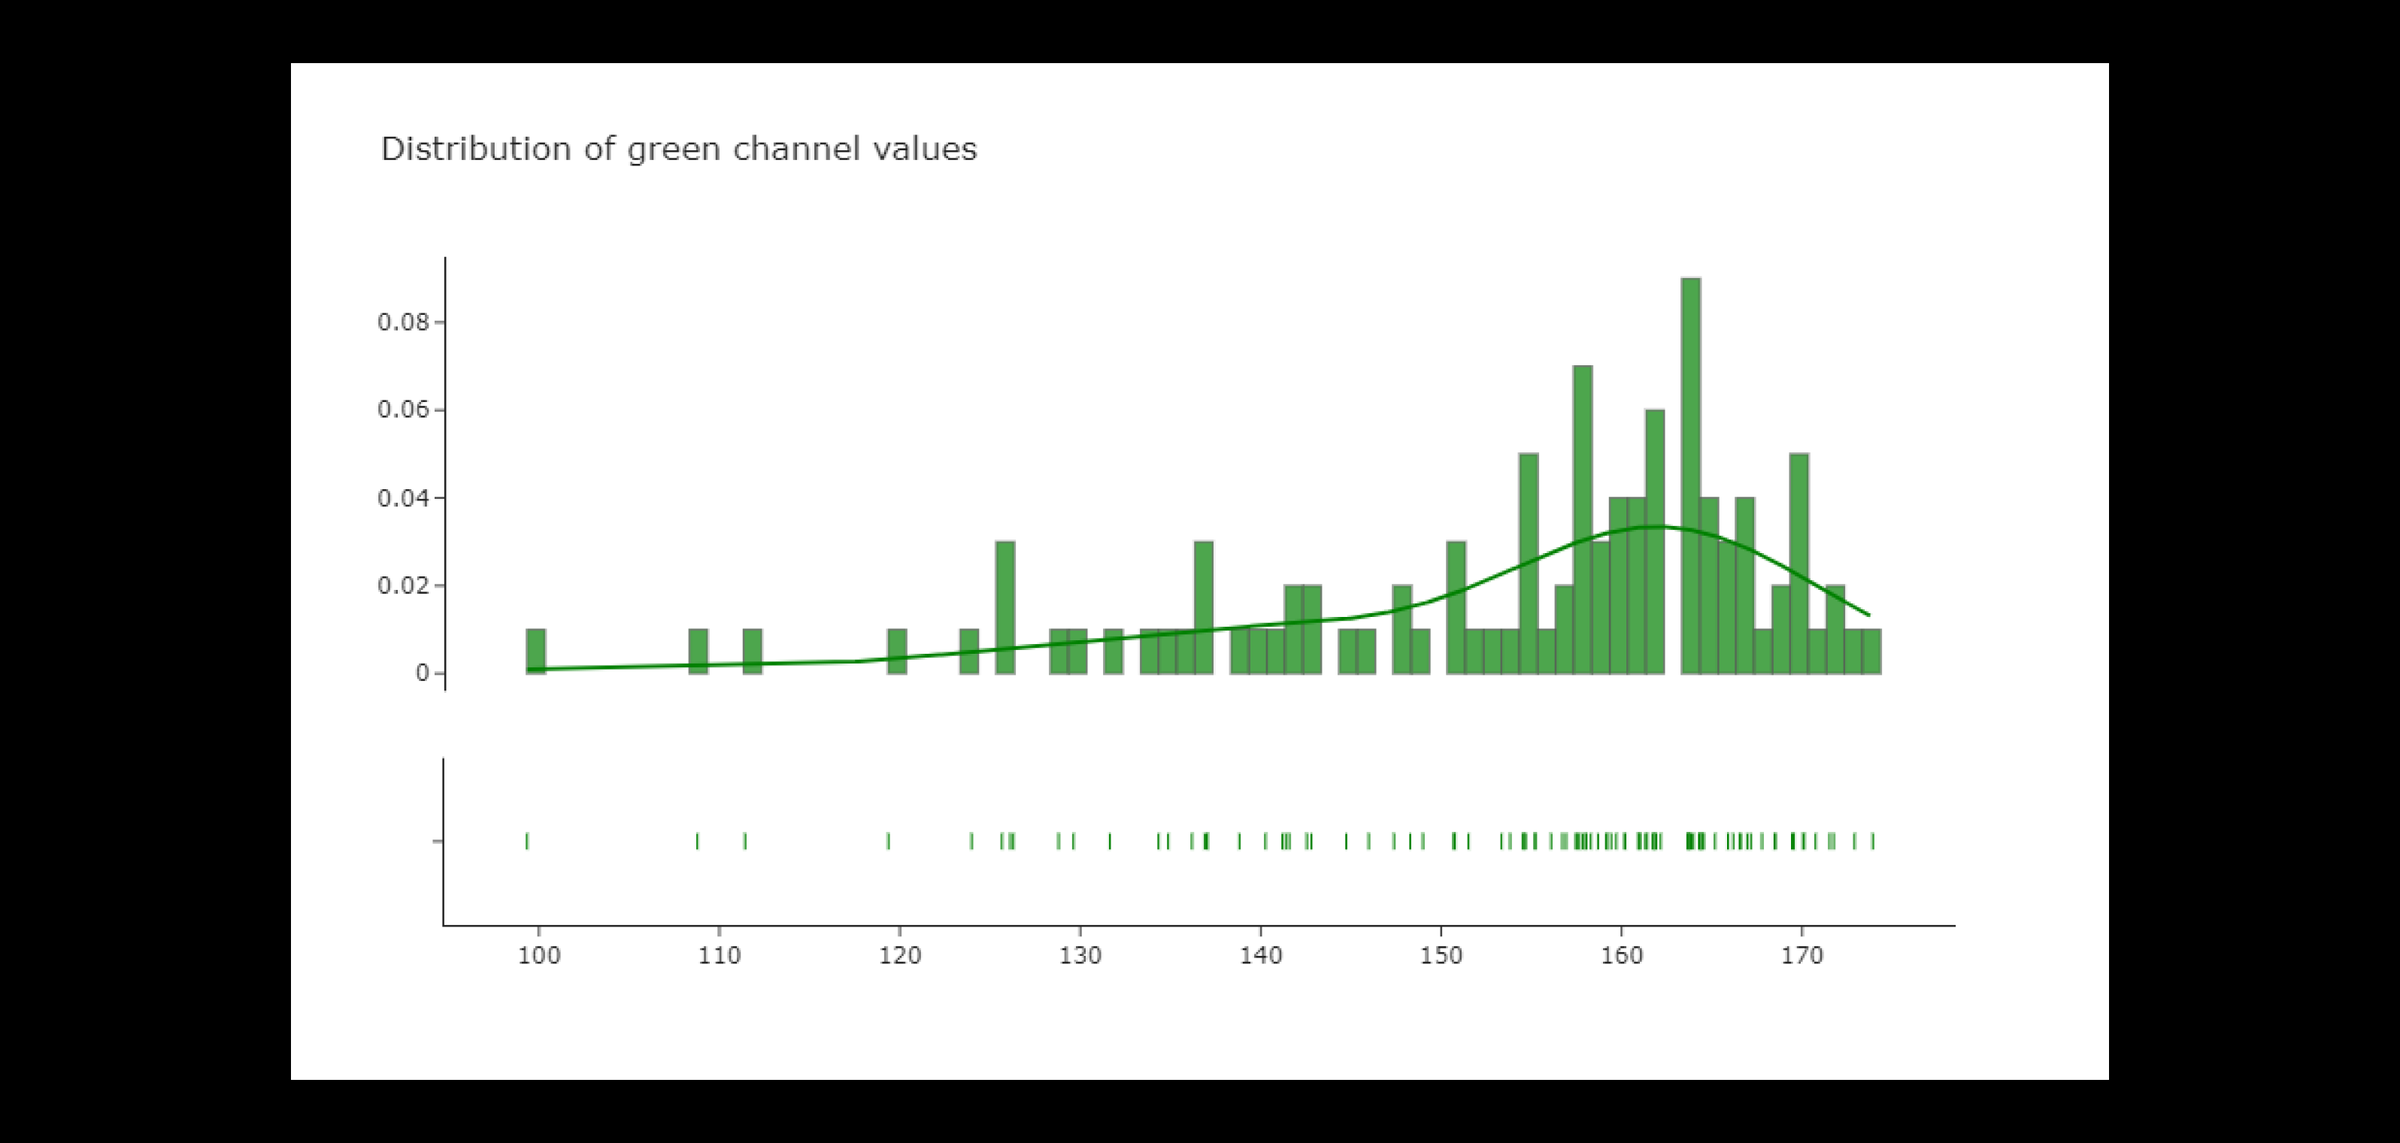
The green channel values are more evenly distributed than the red channel values, but they also have a smaller peak and a right skewed distribution. In addition, the distribution has a larger mode of about 160 and a right skew (in contrast to red). Given that these pictures are of leaves, it makes sense that green is more prominent than red in them.
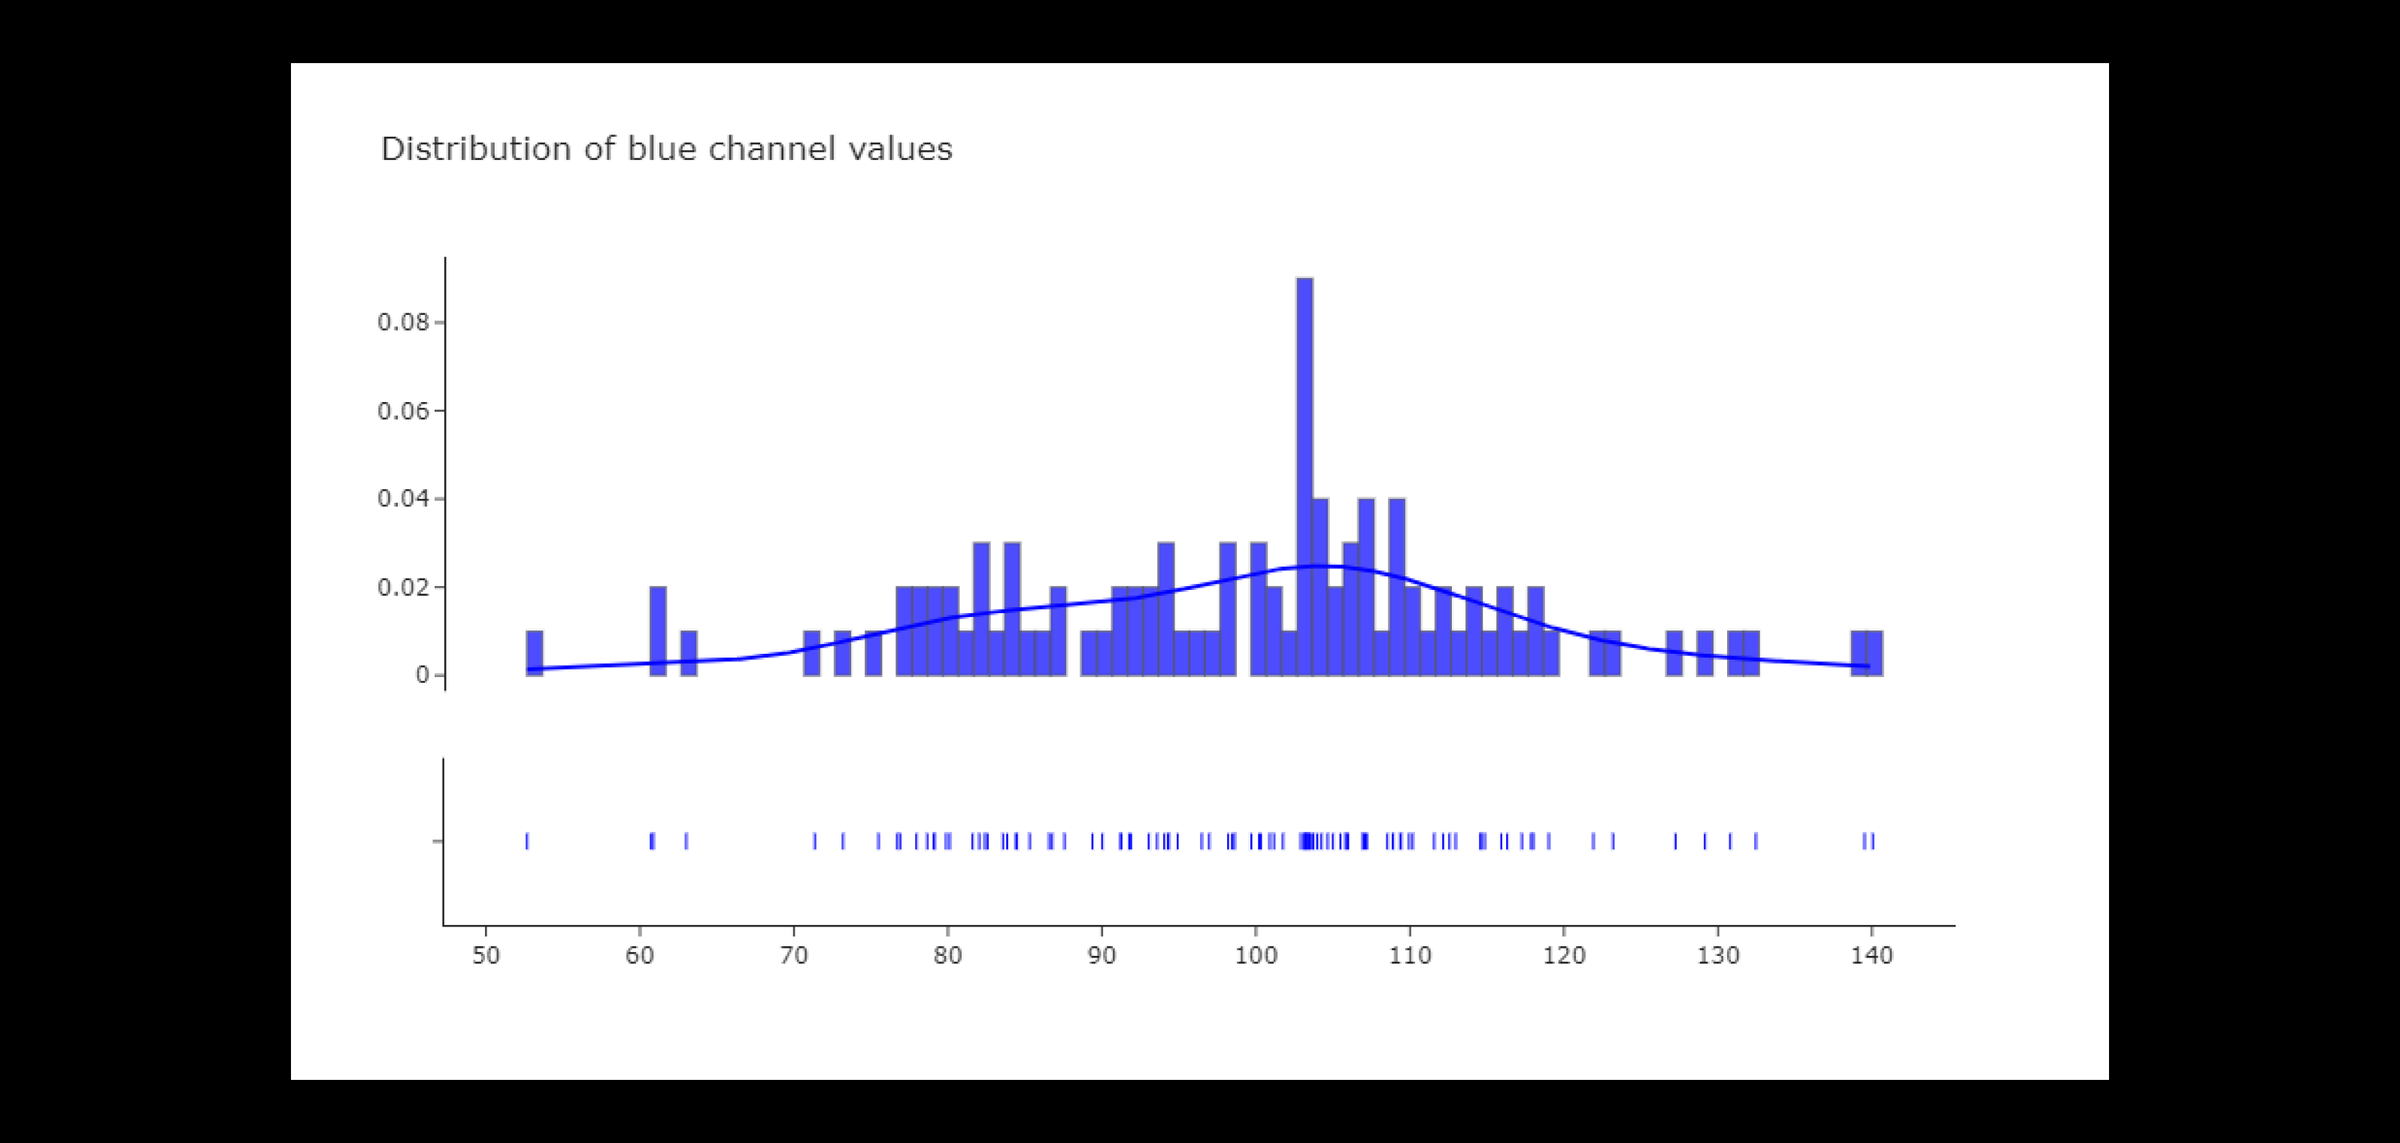
Out of the three color channels, the blue channel exhibits the most consistent distribution and the least skew (slight leftward skew). The blue channel exhibits significant diversity throughout the dataset's photos.
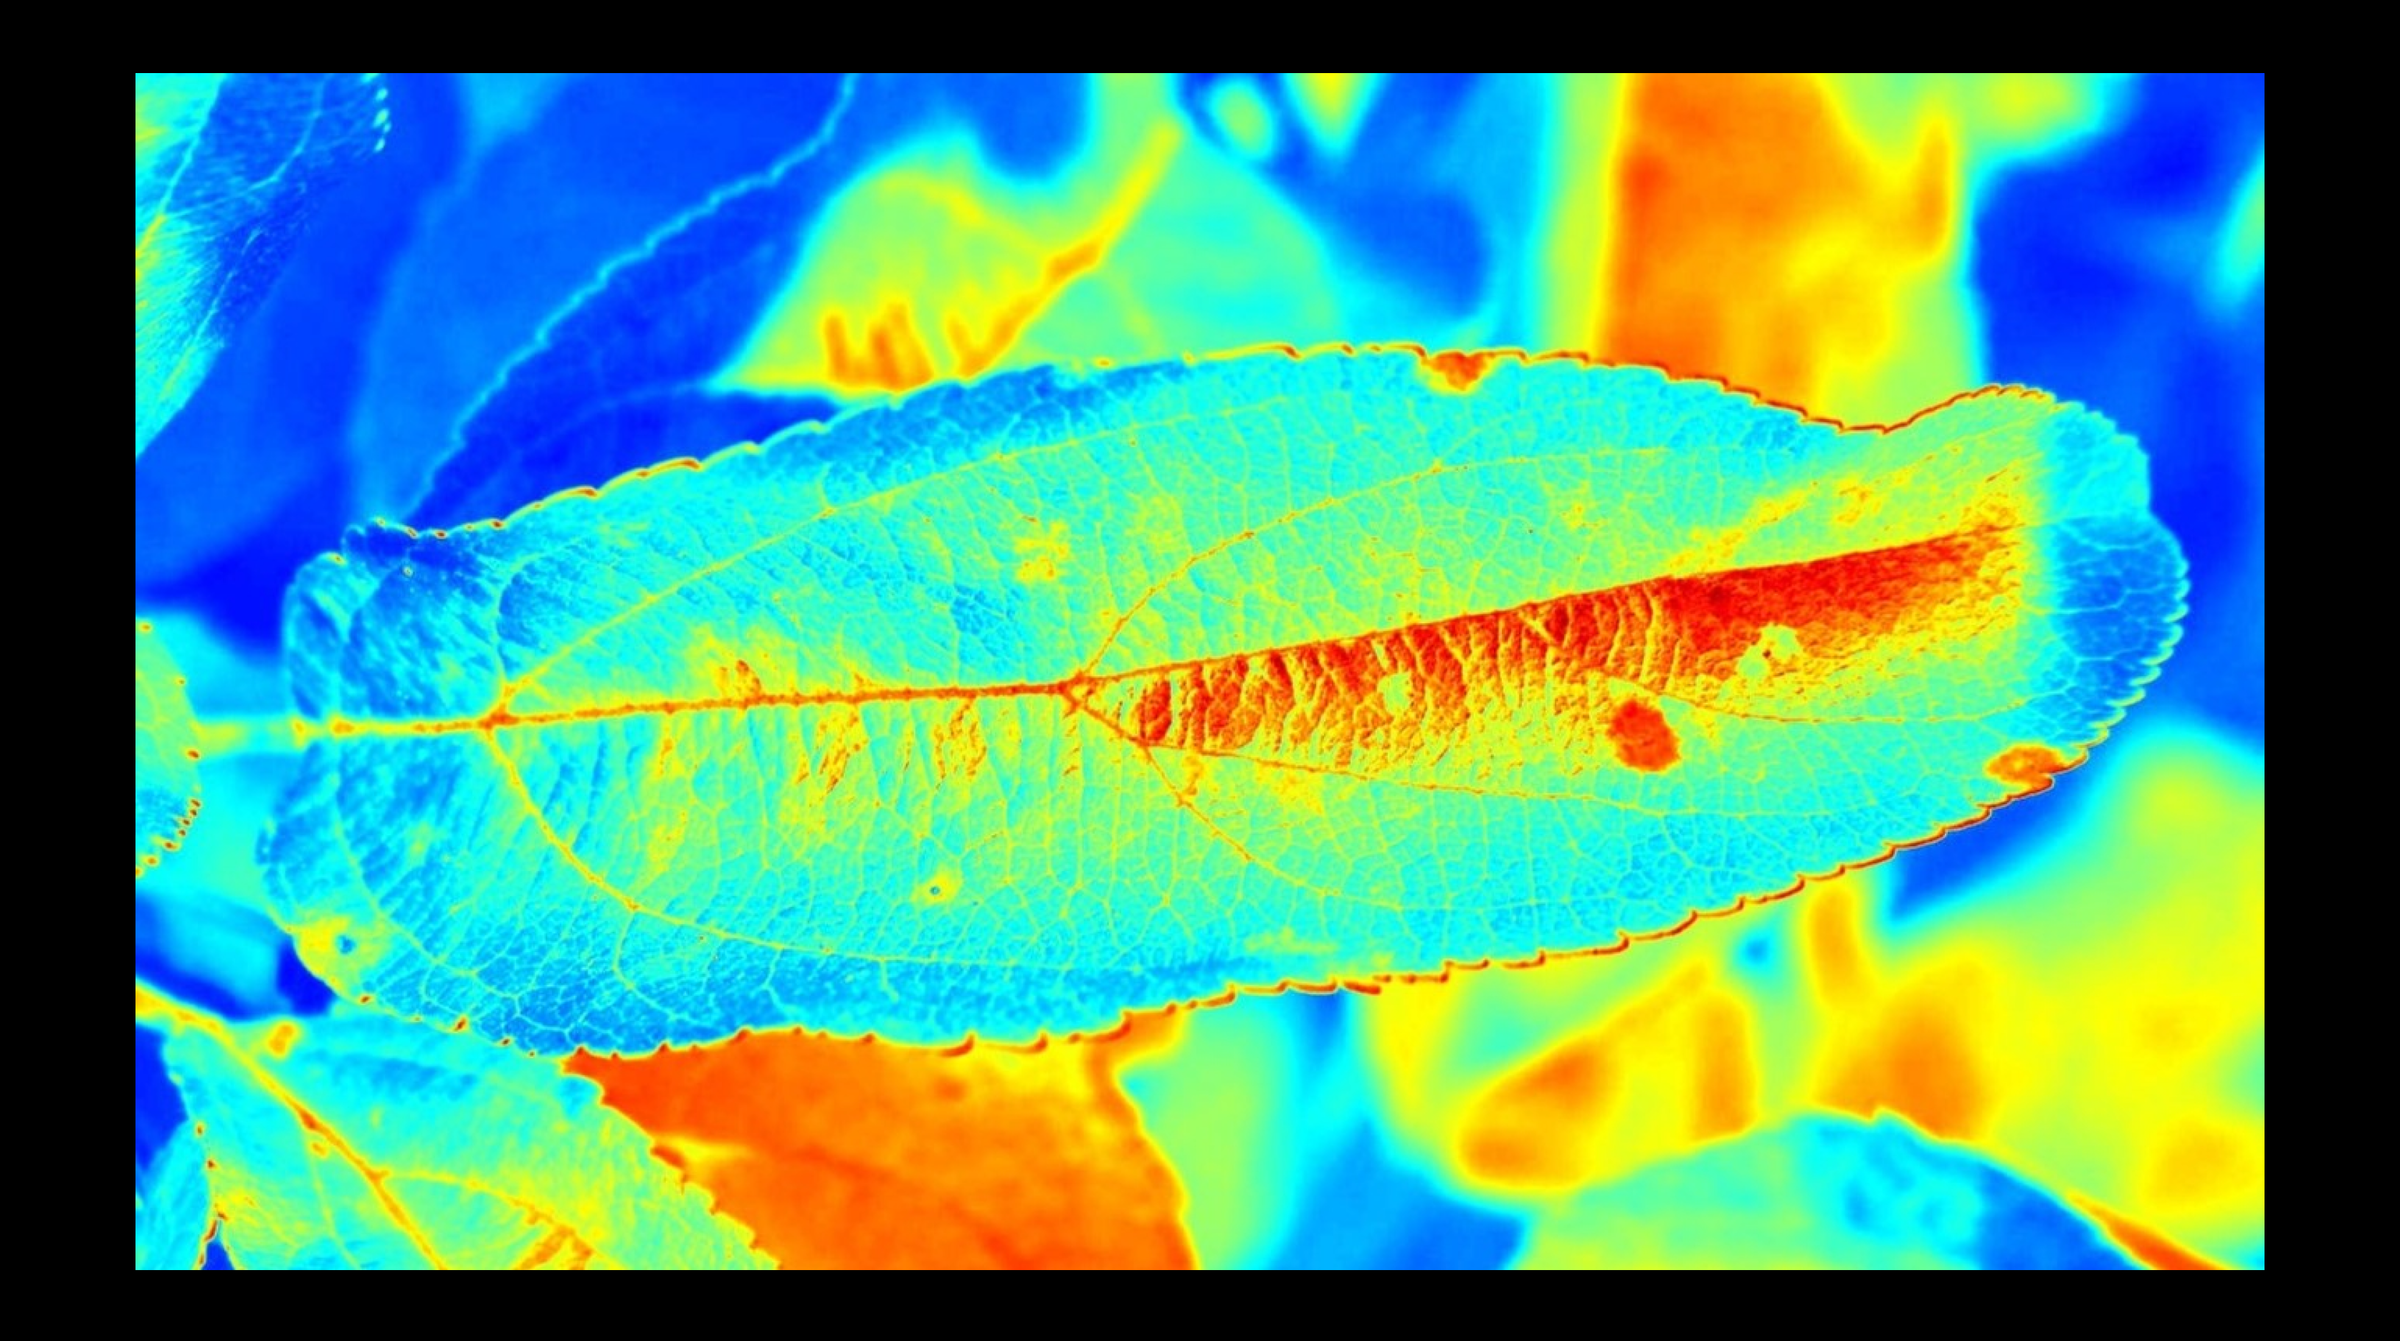
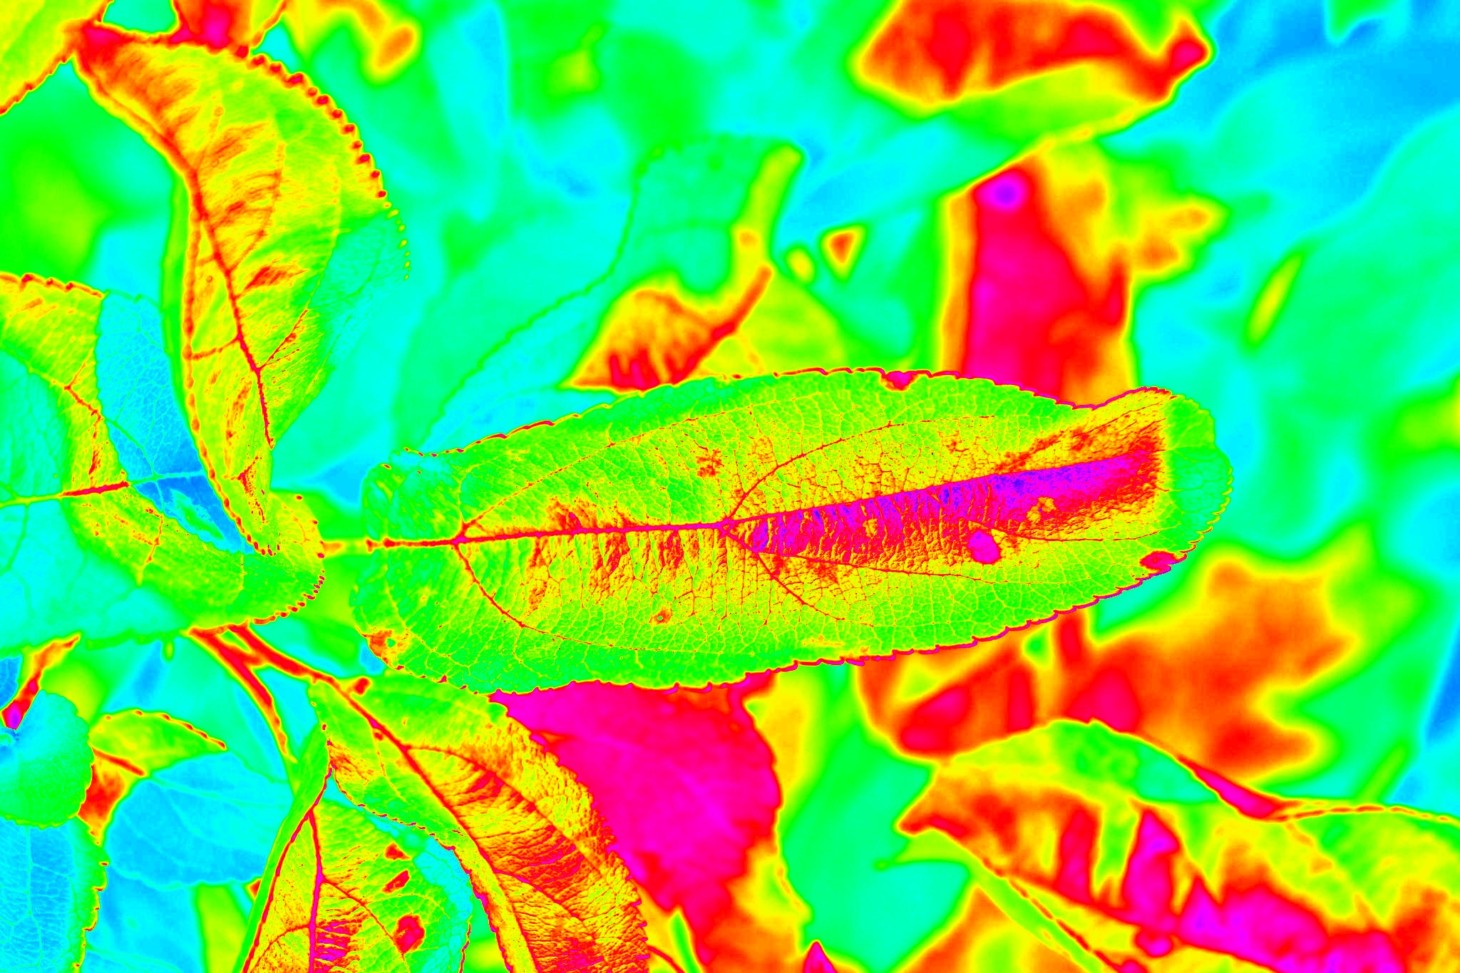
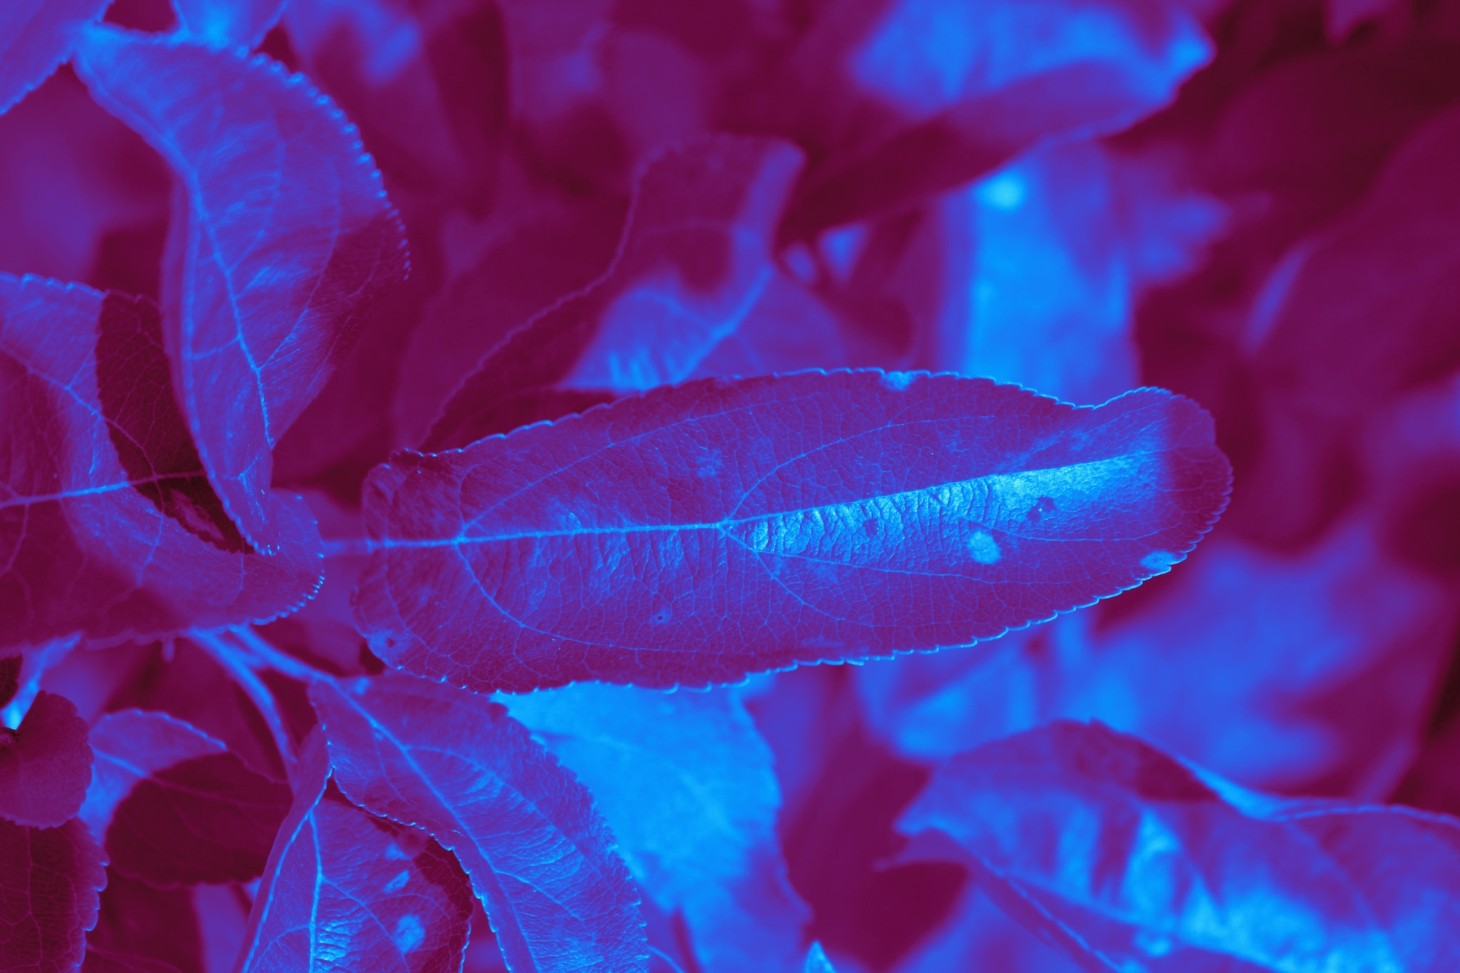
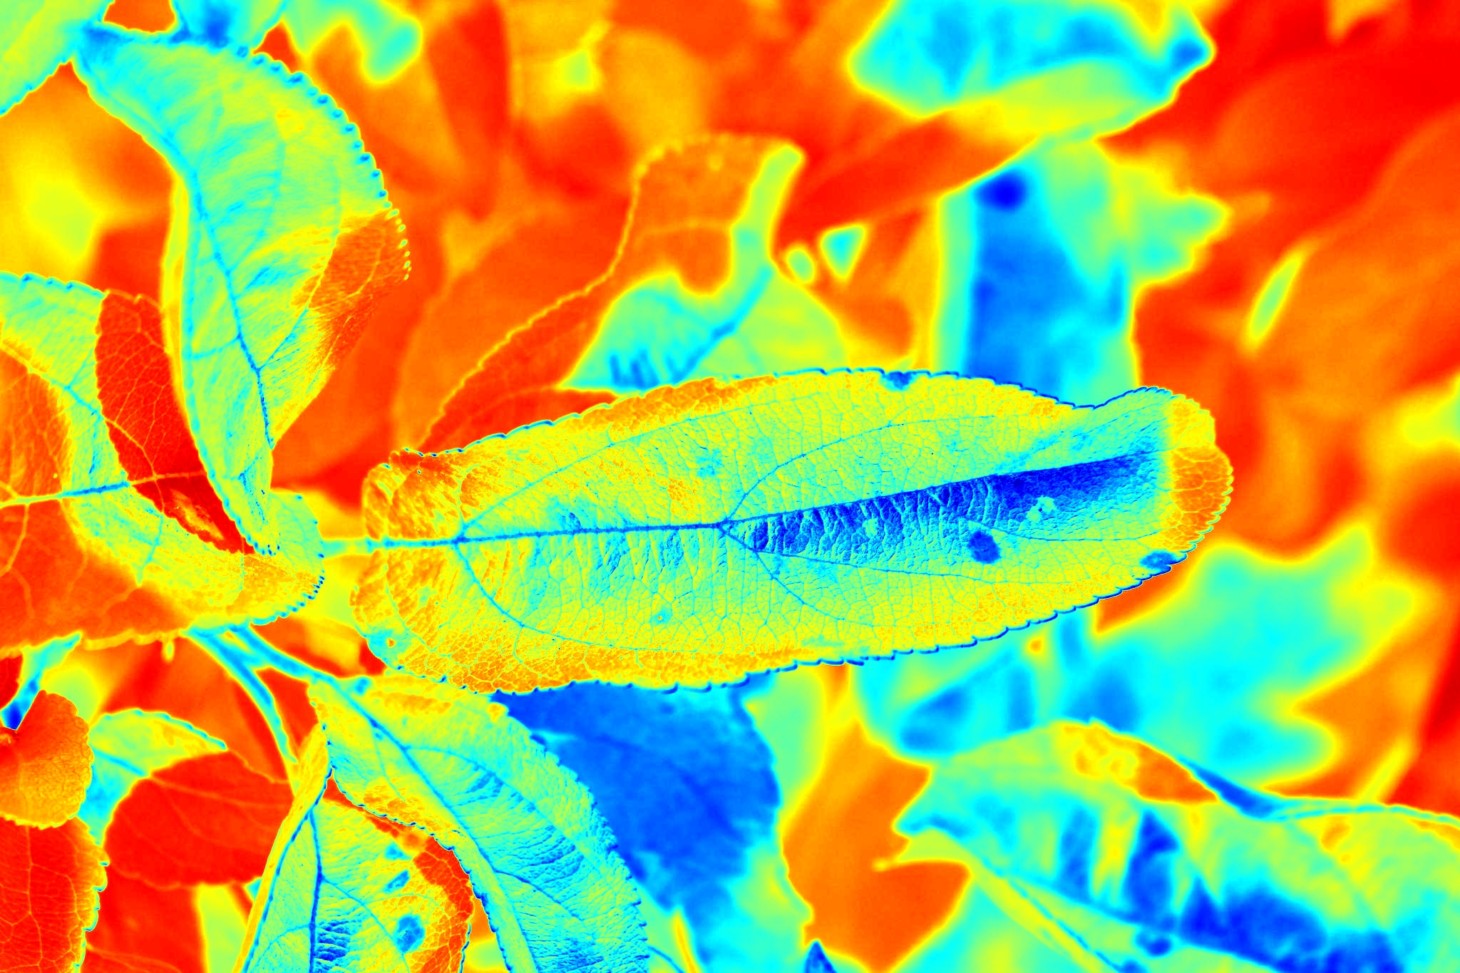
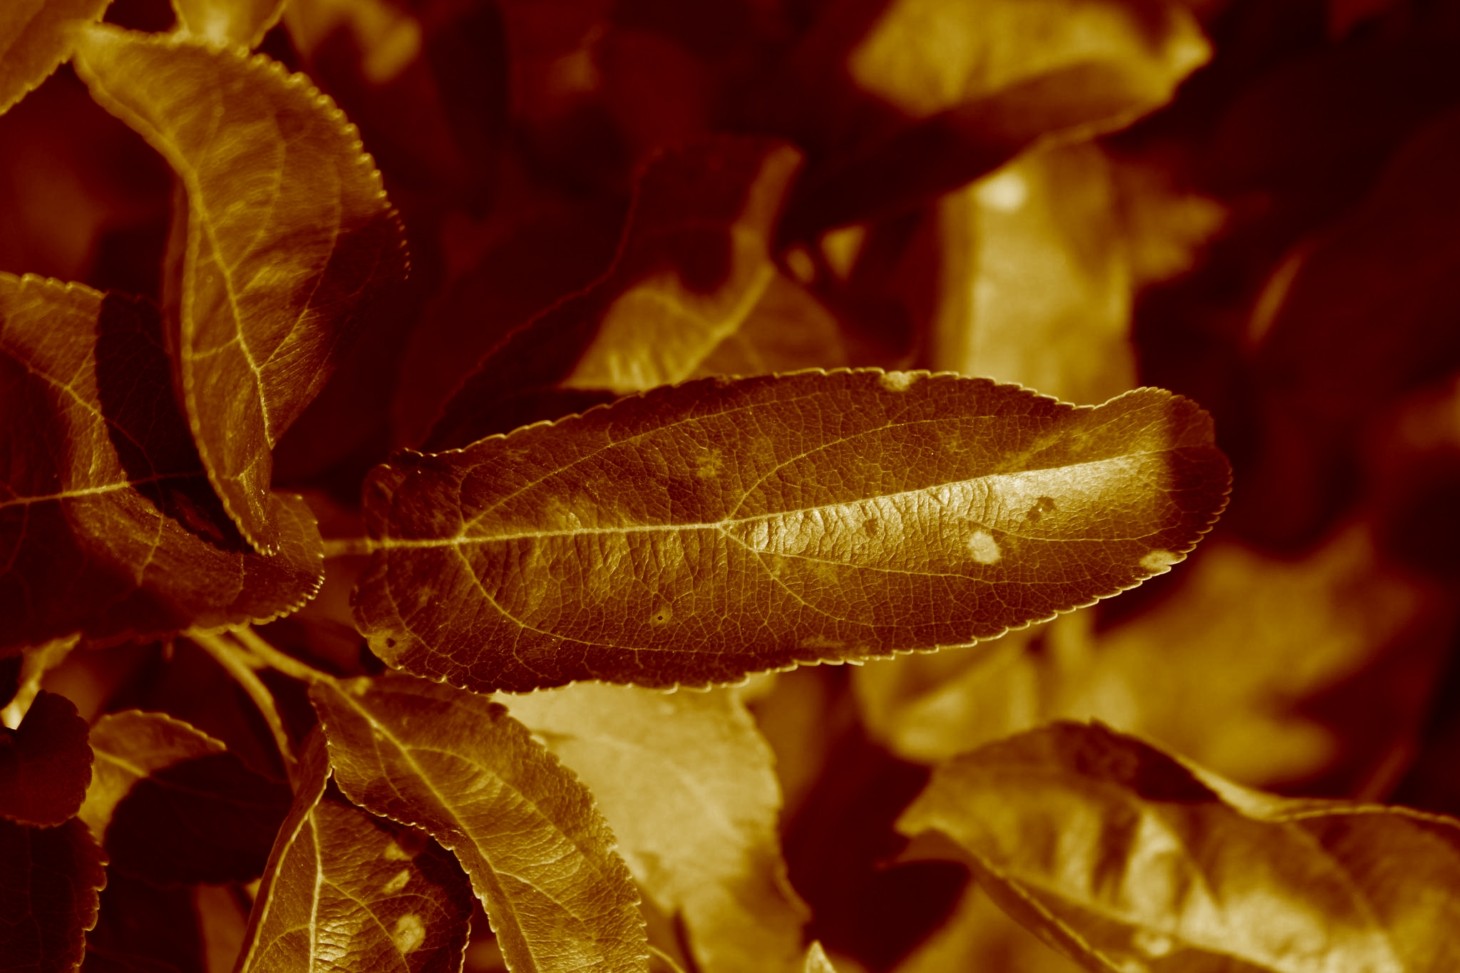
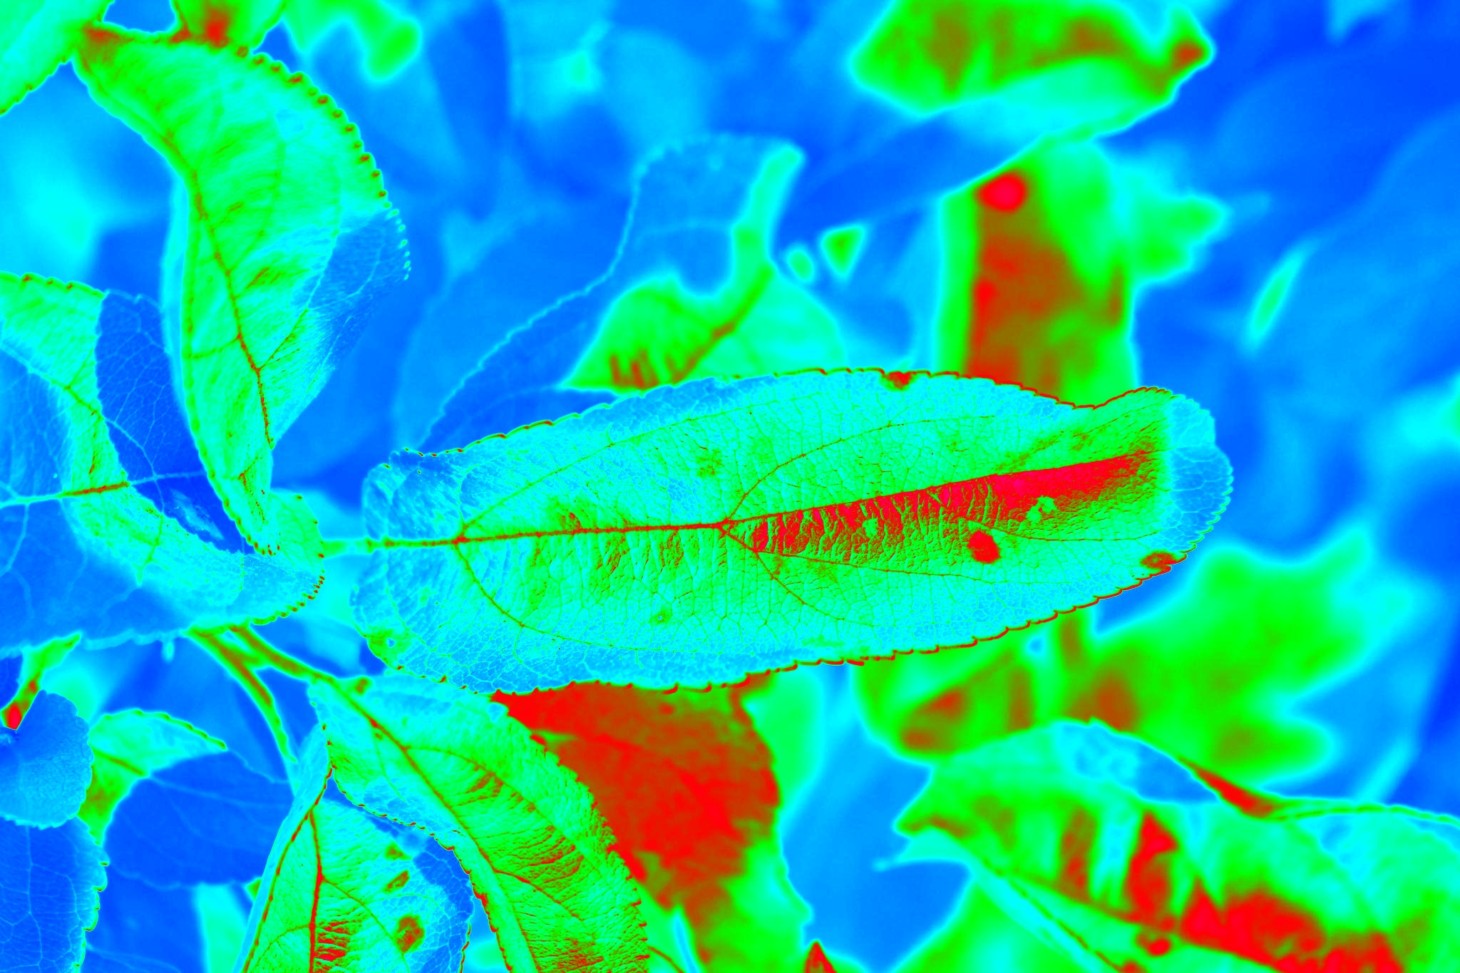
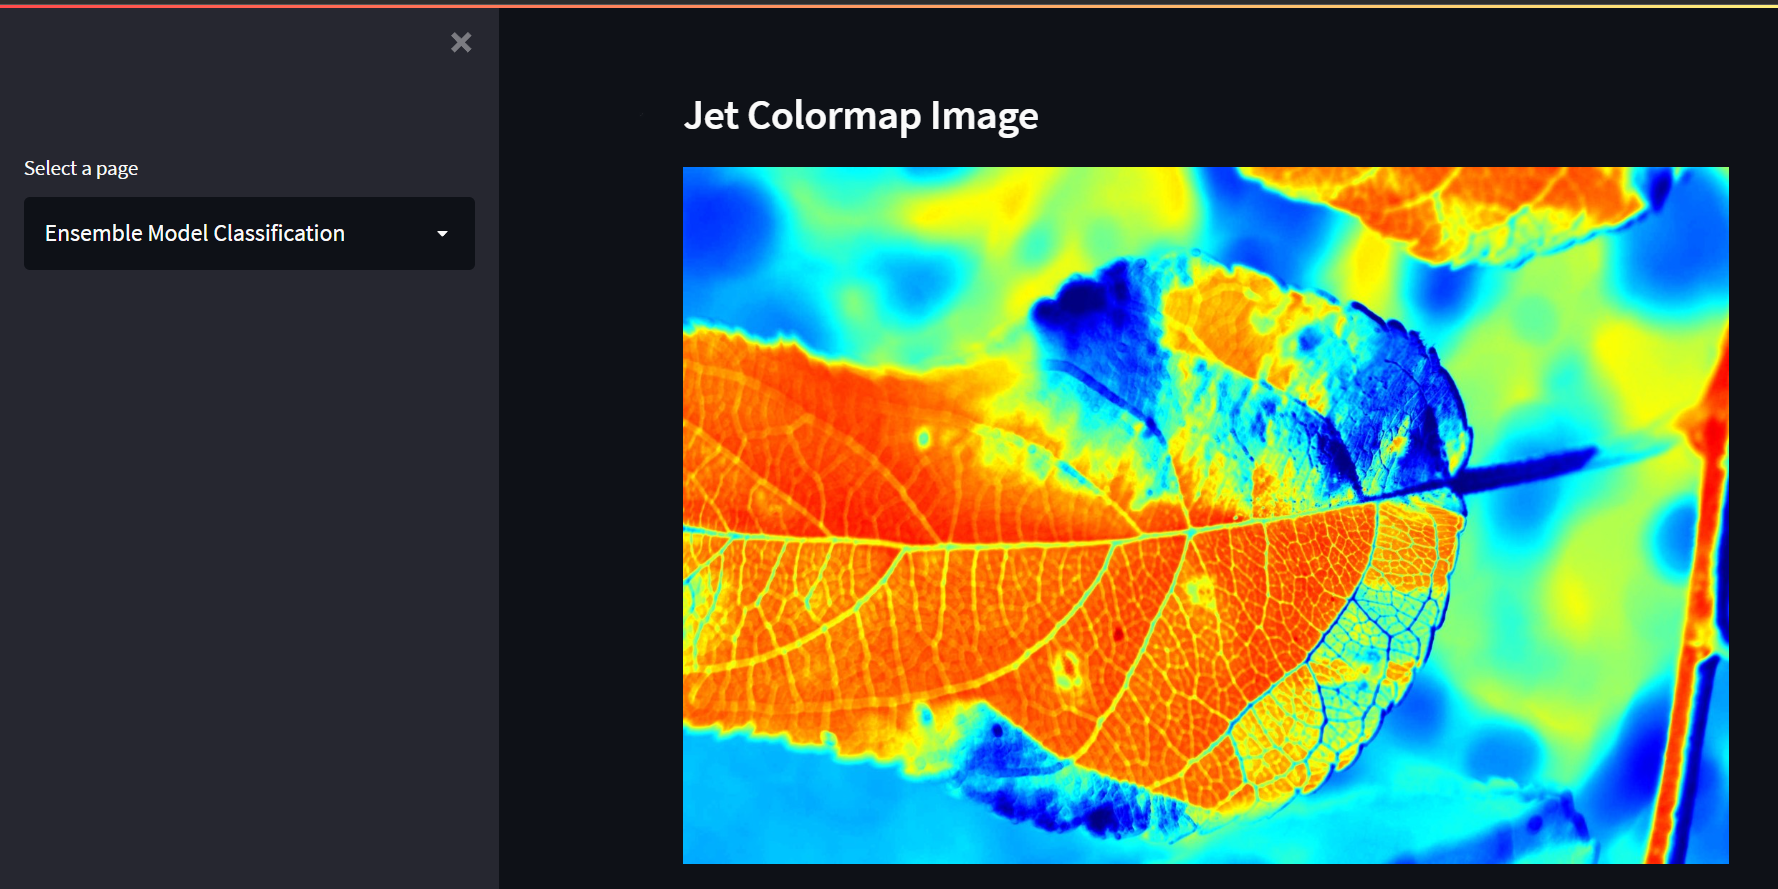
In image pre-processing, we experimented with various color spaces from the OpenCV module. Color spaces help in profiling the images for model training by assigning specific color schemes.
We used jet, bone, inferno, ocean, rainbow, and HSV color spaces from the OpenCV module. Of all, we decided to use jet color space because it significantly distinguishes the diseased portions. As a result, the model would be trained at ease and effectively.
Image pre-processing techniques:
rescaling = 1./255
rotation_range = 180
zoom_range = 0.15
width_shift_range = 0.15
height_shift_range = 0.15
horizontal_flip = True
vertical_flip = True
blurring = Gaussian blurring
| Model | Training Accuracy | Testing Accuracy | Training Loss | Testing Loss |
|---|
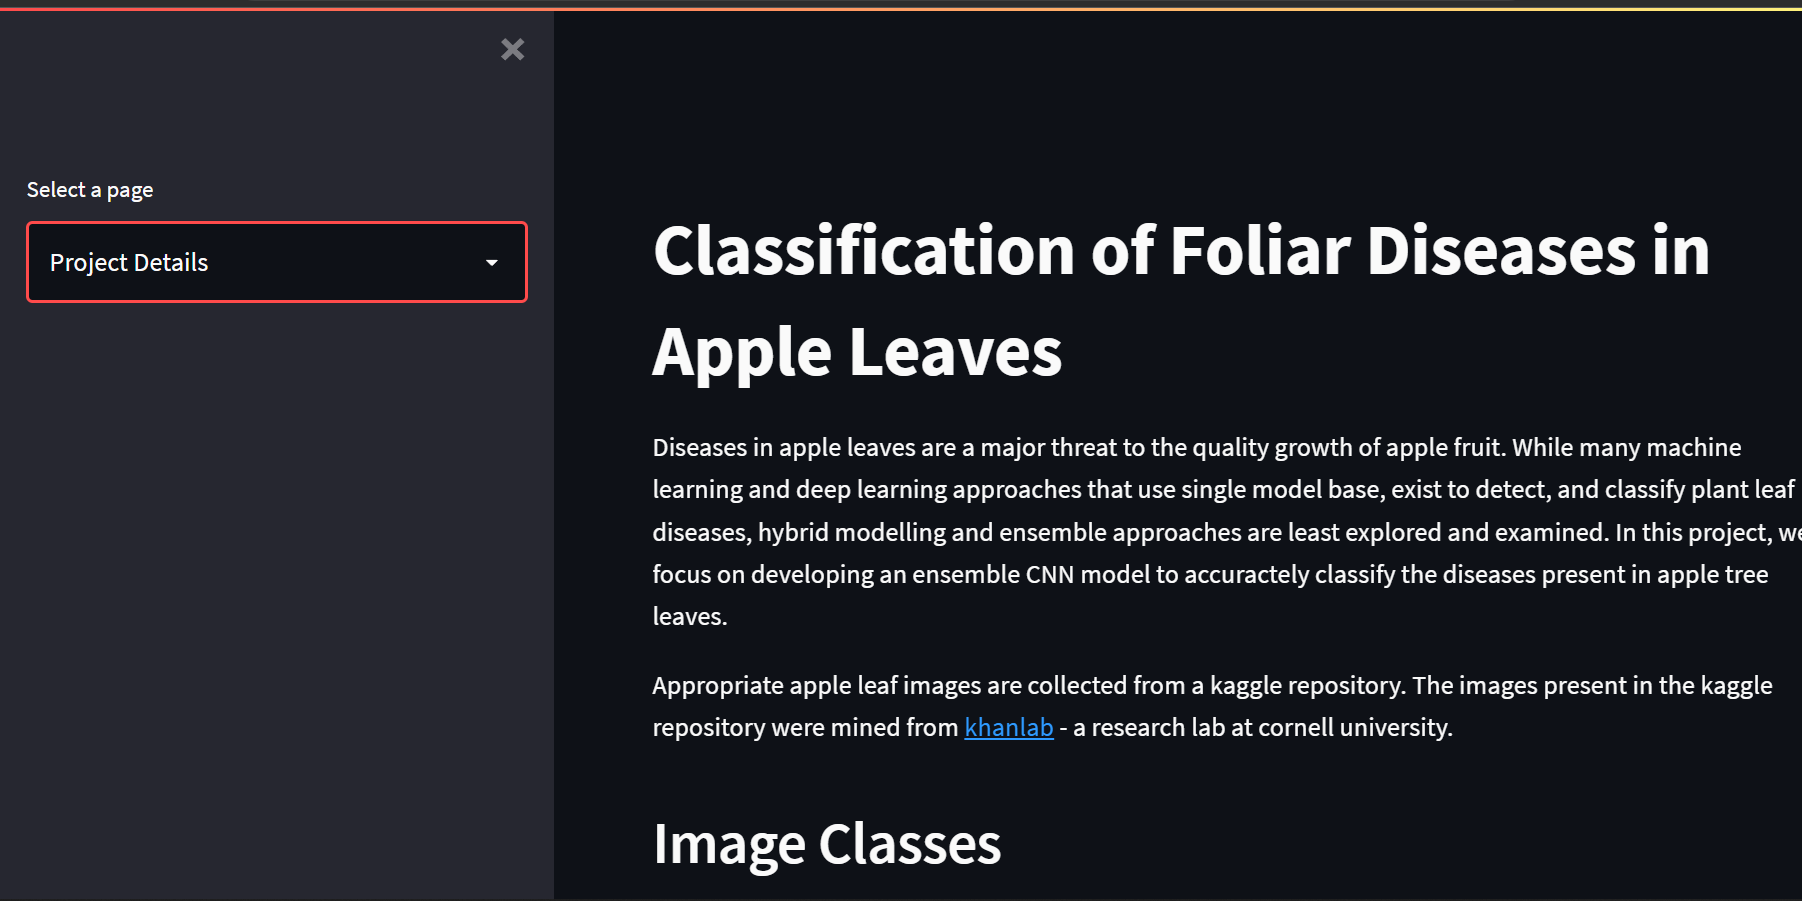
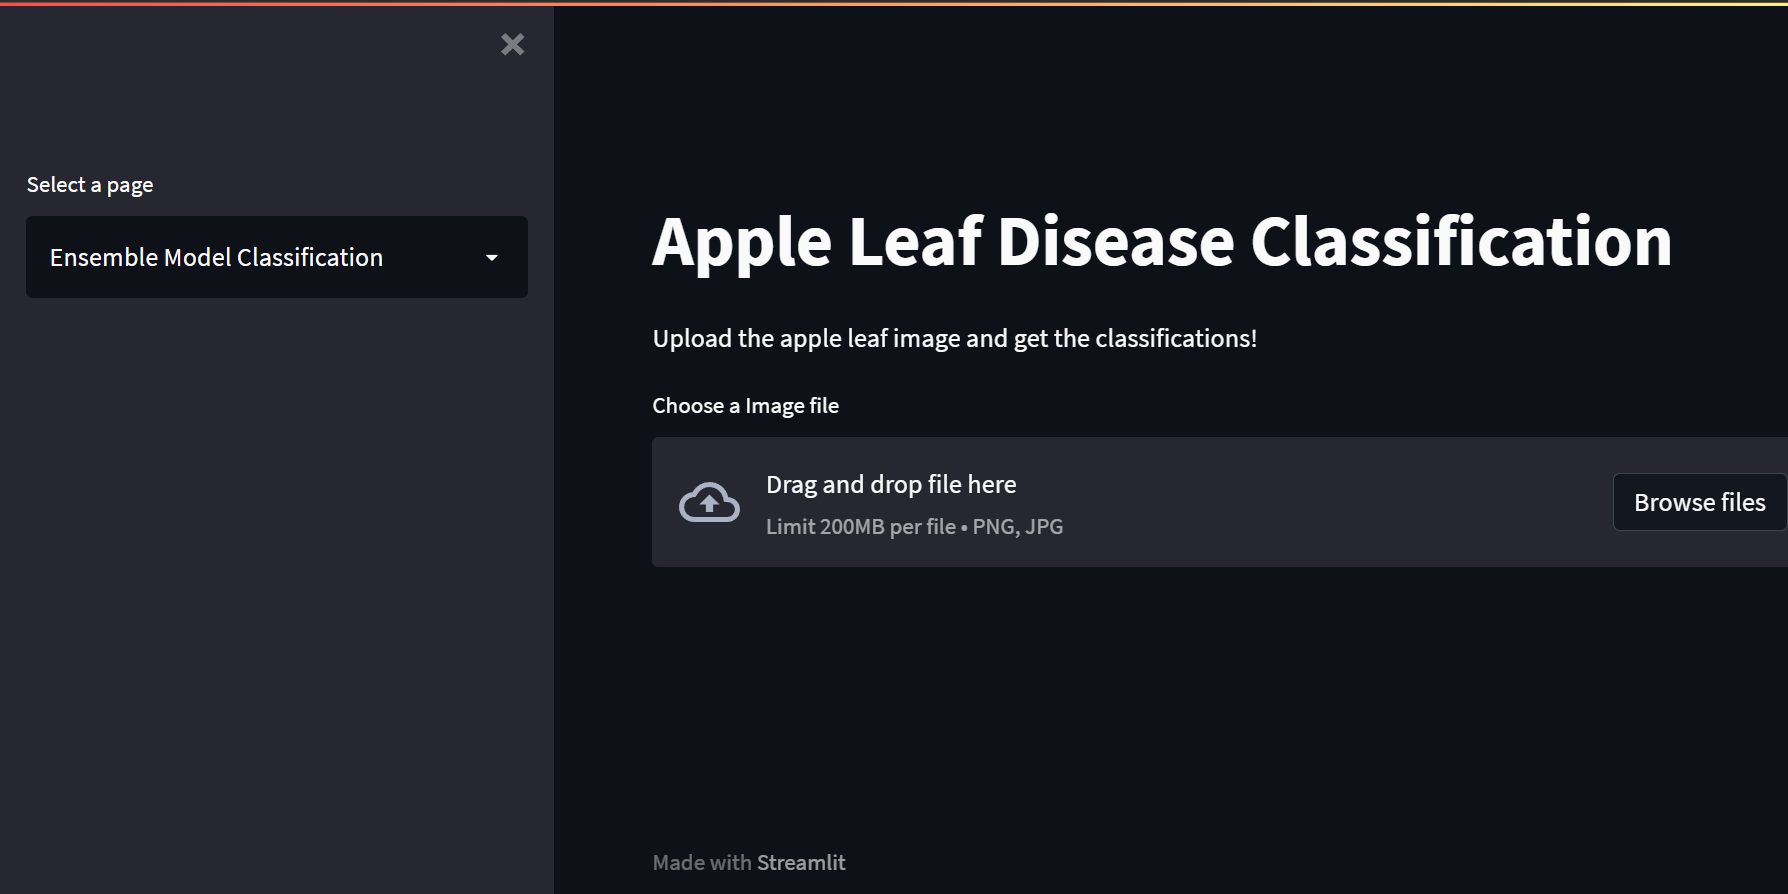
We used streamlit to build the front-end for this project. Streamlit is simple to use and an easy tool to use for deep learning projects.
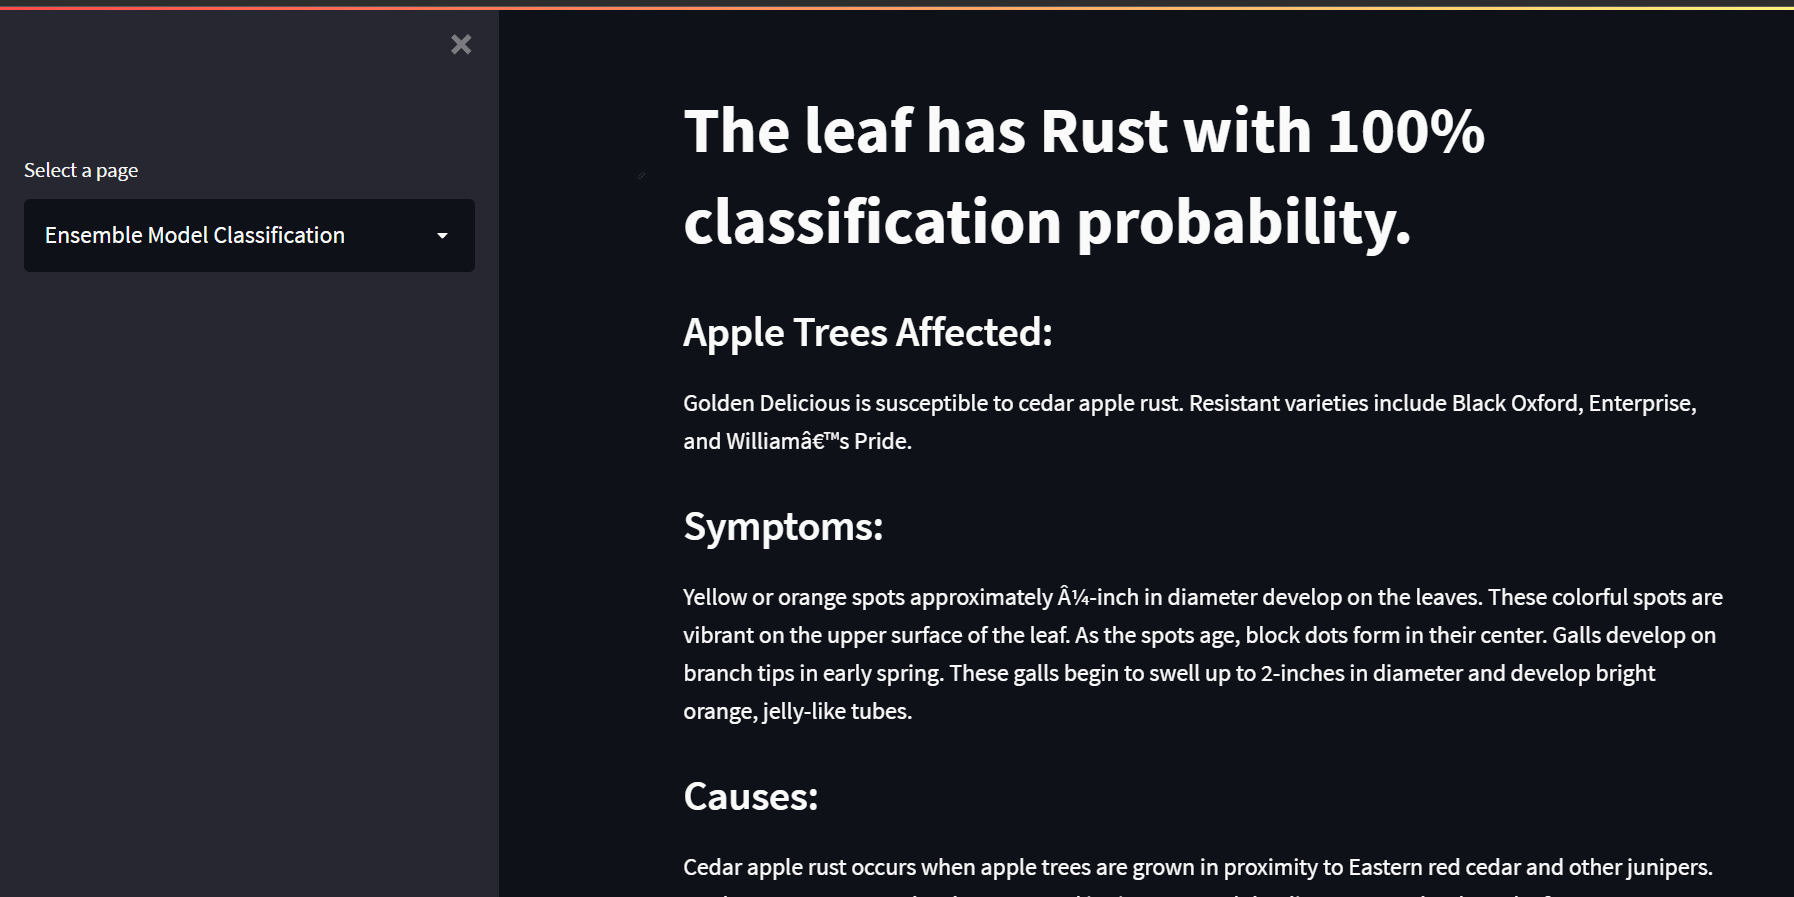
Classification of foliar diseases in apple leaves is essential for apple cultivation.
Ensemble modeling performance is significantly higher than the single base model performance.
Using colormaps can aid significantly in facilitating feature map generation for model learning.
Streamlit is an easy-to-use tool for developing front-end visualization for machine learning projects.
We could have experimented with all transferlearning models for model to deepen the understanding of performance analysis.